
- Title
-
Uptake of oxidative stress-mediated extracellular vesicles by vascular endothelial cells under low magnitude shear stress
- Authors
- Qin, X., Zhang, K., Qiu, J., Wang, N., Qu, K., Cui, Y., Huang, J., Luo, L., Zhong, Y., Tian, T., Wu, W., Wang, Y., Wang, G.
- Source
- Full text @ Bioact Mater

Illustrations displaying that oxidative stress is involved in RBCEVs uptake by endothelial cells under low magnitude shear stress. (a) Preparation procedures of RBCEVs. (b) Low magnitude shear stress (LSS and OSS) promotes the uptake of RBCEVs by endothelial cells in vivo. (c–e) LSS-induced oxidative stress of endothelial cells is a regulator of EVs uptake. |

Characterization of RBCEVs. (a–b) NTA of RBCEVs and DiD@RBCEVs. (c) Zeta potential of RBCEVs and DiD@RBCEVs. (d) Proteins in RBCEVs and RBC ghosts were characterized by SDS-PAGE. (e) Western blot analysis of CD47 in RBCEVs, RBC ghosts, and RBC. (f–g) TEM images of RBCEVs and DiD@RBCEVs. (n = 3) (scale bar = 50 nm). Significance is indicated as no significance (ns). |

Low magnitude shear stress promotes the uptake of RBCEVs by endothelial cells. (a) Model diagram of orbital shaker system. (b) Laser confocal images of RBCEVs that were uptake by endothelial cells at different shear stresses for 3 h. (c) and (g) Flow cytometry analysis of the uptake of RBCEVs by endothelial cells for 3 h. (d) Mechanical loading equipment model diagram of the parallel-plate flow chamber. (h), (j), and (l) Laser confocal images of RBCEVs that were uptake by endothelial cells under NSS, LSS, and OSS for 3 h. (i), (k), and (m) Imaris 3D rendering for (h), (j), and (l), respectively. (n), (o), and (p) XYZ axis showed uptake in different directions. (e) Quantitation of the number of RBCEVs uptake by endothelial cells and (f) mean fluorescence intensity of RBCEVs from (h), (j), and (l). (n = 5) (scale bar = 20 μm). Significance is indicated as no significance (ns), or P < 0.001 (***). |

Uptake of RBCEVs by endothelial cells at different blood flow velocities. (a) Images were taken with a laser confocal microscope. RBCEVs were injected into the heart. (b) Model diagram of zebrafish. (c) Blood flow velocities in the four different blood flow regions. (d) In the laser confocal image, the red puncta in the square represent RBCEVs at four speeds. (e) Number of RBCEVs uptake per visual field (scale bar = 500 μm). (f) In the laser confocal image, white arrows point to RBCEVs that were uptake by vascular endothelial cells at 3 h. (g) XYZ axis showed uptake in different directions. (h) Imaris 3D rendering and (i) front and lateral view (n = 8) (scale bar = 100 μm). Significance is indicated as P < 0.05 (*), or P < 0.001 (***). |
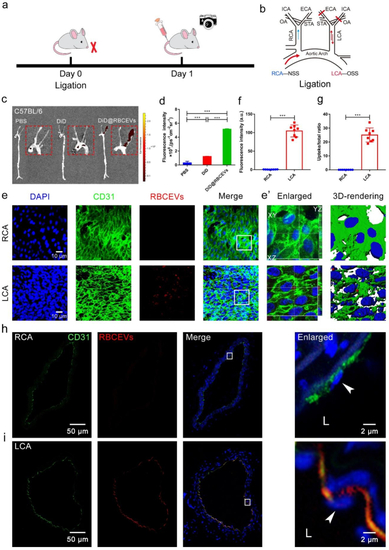
OSS promotes the uptake of RBCEVs by endothelial cells in C57BL/6 mice. (a) Schematic of ligation establishment. (b) LCA of mice was ligated and immediately injected with DiD@RBCEVs. (c) Small animal optical imaging system. (d) Quantitative analysis of (c). (e) En face immunofluorescence images. OSS increased the uptake of RBCEVs by endothelial cells. (f) Quantitative analysis of mean fluorescence intensity and (g) uptake ratio. RCA: non-ligation; LCA: ligation for 1 day, injected once. The mice in each group were sacrificed 1 h after the last injection. (e’) Imaris 3D rendering. (n = 8) (scale bar = 10 μm). (h–i) Immunofluorescence images and transection of the carotid artery. The white box indicates that the picture is locally enlarged, as indicated by the white arrow. LCA: ligation for 1 day, injection for 1 time, RCA: unligation. The mice in each group were sacrificed 1 h after the last injection. L: lumen. (n = 8) (scale bar = 50 μm). Significance is indicated as P < 0.001 (***). |
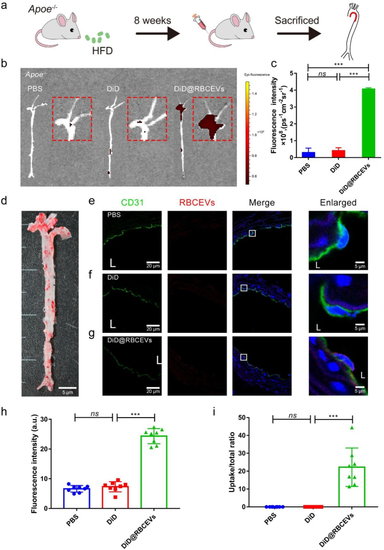
Uptake of RBCEVs by endothelial cells in Apoe−/− mice. (a) Schematic of Apoe−/- mice. (b) Small animal optical imaging system. (c) Quantitative analysis of (b). (d) Oil Red O Staining on the total aorta. (e) to (g) Laser confocal images in the aorta. The white box indicates that the picture is locally enlarged, as indicated by the white arrow. (h) Quantitative analysis of mean fluorescence intensity and (i) uptake ratio. L: lumen. (n = 8) (scale bar = 20 μm) (scale bar = 5 μm). Significance is indicated as no significance (ns), or P < 0.001 (***). |

Low magnitude shear stress-induced oxidative stress of endothelial cells was a regulator of RBCEVs uptake. (a) Model diagram of endothelial cells uptake in different shear stresses. (c) Laser confocal images of RBCEVs uptake by endothelial cells in different shear stresses. (b) and (d) Flow cytometry analysis for uptake of RBCEVs by endothelial cells in different shear stresses. (e–f) ROS production was measured by CM-H2DCFDA probe in vitro. (g–h) ROS production was measured by CM-H2DCFDA probe in vivo. (i) SOD, MDA, and MCP-1 levels were detected by an ELISA assay. (j–k) Flow cytometry analysis of RBCEVs uptake by endothelial cells treated with two antioxidants. L: lumen. (n = 5). Significance is indicated as no significance (ns), or P < 0.001 (***). |