FIGURE SUMMARY
Title

HIVEP1 Is a Negative Regulator of NF-κB That Inhibits Systemic Inflammation in Sepsis

Authors
Matsumoto, H., Scicluna, B.P., Jim, K.K., Falahi, F., Qin, W., Gürkan, B., Malmström, E., Meijer, M.T., Butler, J.M., Khan, H.N., Takagi, T., Ishii, S., Schultz, M.J., van de Beek, D., de Vos, A.F., van 't Veer, C., van der Poll, T.
Source
Full text @ Front Immunol

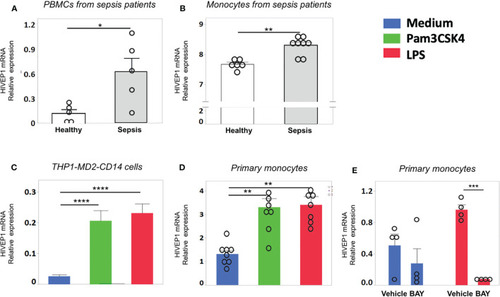
HIVEP1 mRNA expression is increased in patients with sepsis and upon stimulation with bacterial agonists in vitro. HIVEP1 mRNA in PBMCs (A) and monocytes (B) from patients with sepsis (5 and 8 individual donors, respectively) upon admission to the intensive care unit and in healthy subjects (5 and 6 individual donors, respectively). The monocytes data was obtained from GEO database (GSE46955). (C) HIVEP1 mRNA in human monocytic wild type THP1-MD2-CD14 cells incubated with medium, PAM3CSK4 (1 µg/ml) or LPS (100 ng/mL) for 4 hours. (D) HIVEP1 mRNA in primary human monocytes incubated with medium (control), PAM3CSK4 (1 µg/ml) or LPS (100 ng/mL) for 4 hours. For (C), three experiments with four replicates were conducted. For (D), two experiments each with 4 independent donors (8 individual donors in total) were conducted. Pooled data from three (C) or two (D) independent experiments are displayed. (E) HIVEP1 mRNA in primary human monocytes (from 4 individual donors) incubated with medium or LPS (100 ng/mL) for 2 hours in the presence or absence of the NFκB inhibitor BAY11-7082 (or vehicle) added 30 minutes prior to LPS. HIVEP1 mRNA expression was normalized to HPRT mRNA (A, C, D, E). For (B) normalized gene expression values were used as provided in GSE46955. Data shows means ± SEM with individual data shown as dots. *P < 0.05, **P < 0.01, ***P < 0.001, ****P < 0.0001.

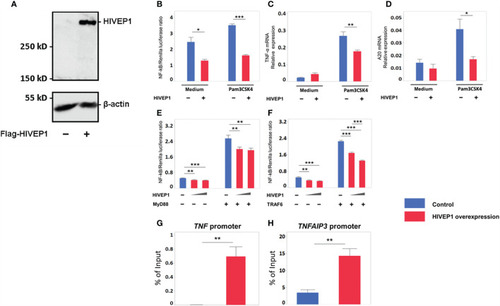
Overexpression of HIVEP1 inhibits NF-κB activity upon Toll-like receptor stimulation and binds to the TNF and TNFAIP3 promoter regions. (A) HIVEP1 protein expression in HEK293T cells transfected with HIVEP1 expression vector (1 µg) or control plasmid (B–D) CD14/TLR2 HEK293T cells were transfected with 83 ng of HIVEP1 or control vector together with 33 ng of NF-kB and 0.7 ng of Renilla constructs and incubated with medium or PAM3CSK4 (1 µg/mL); overexpression of HIVEP1 was associated with reduced activity of NF-κB (B), and reduced expression of TNF-α mRNA (C) and A20 mRNA (D). HEK293T cells transfected with MyD88 (E) or TRAF6 (F) (or control cells) were co-transfected with increasing doses of HIVEP1 expression vector (0, 30 or 150ng); these MyD88 or TRAF6 transfected cells were not stimulated with PAM3CSK4; overexpression of HIVEP1 was associated with a dose-dependent inhibition of MyD88 or TRAF6 driven NF-κB activity. mRNA expression was normalized to HPRT mRNA. Data shows means ± SEM. (G, H) HEK293T cells were transfected with 30 µg of HIVEP1 expression vector or control plasmid. 24 hours after transfection, the cells were collected for CHIP analysis. RT-qPCR amplification was performed with total DNA and immunoprecipitated DNA using TNF and TNFAIP3 promoter primers spanning the NF-κB binding regions. Data shows means ± SEM and presented as a percentage of input DNA. Data shown were pooled from two (A,B,C), three (E, F) independent data sets (four replicates samples for each condition within each experiment) and three (G, H) independent data sets (two duplicate samples for each experiment)*P < 0.05, **P < 0.01, ***P < 0.001.

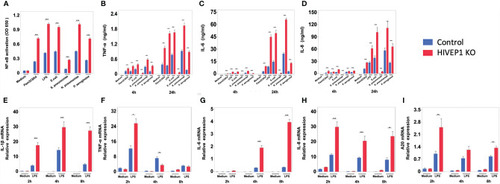
HIVEP1 deficient human monocytic cells show increased NFκB activity and proinflammatory cytokine production upon stimulation with TLR ligands or bacteria. HIVEP1 deficient and control human monocytic THP1-MD2-CD14 cells were stimulated with PAM3CSK4 (1 µg/mL), LPS (100 ng/mL), heat-killed E. coli, S. pneumoniae, K. pneumoniae or P. aeruginosa. HIVEP1 deficiency was associated with (A) enhanced NFκB activity (24-hour stimulation), (B–D) enhanced TNF-α, IL-6 and IL-8 release (4 and 24 hour stimulation) and (E–I) increased IL-1β, TNF-α, IL-6, IL-8 and A20 mRNA expression (normalized to HPRT mRNA). Data shows means ± SEM and were pooled from two (E–I) and three (A–D) independent data set (n = 4 for each condition within each experiment). *P < 0.05, **P < 0.01, ***P < 0.001.

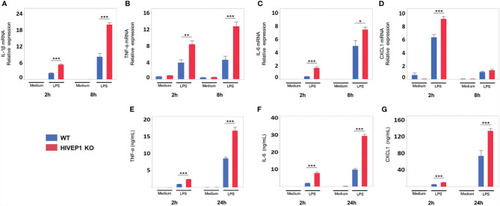
HIVEP1-deficient murine macrophages show increased proinflammatory cytokine production upon stimulation with LPS. Bone marrow derived macrophages from hivep1-/- mice and wild type littermates were stimulated with LPS (100 ng/mL). Hivep1-/- macrophages showed increased expression of TNF-α, IL-1β, IL-6, CXCL1 mRNA upon LPS stimulation (A–D), as well as enhanced TNF-α, IL-6 and CXCL1 protein release (E–G). Data shows means ± SEM and were pooled from three independent data set [n = 4 (A–D) or n = 12 (E–G) for each condition within each experiment)]. *P < 0.05, **P < 0.01, ***P < 0.001.

RNA-sequencing of HIVEP1 deficient THP-1 cells before and after LPS stimulation. (A) Principal component plot of 30,013 genes per sample showing clustering of HIVEP1 deficient cells and controls at baseline and after 2 and 8 hours culturing in medium. (B) Volcano plot depicting genome-wide changes in gene expression of HIVEP1 deficient cells relative to controls at baseline. Green dots denote high expression genes (Benjamini-Hochberg (BH) adjusted p < 0.01 and fold change ≥ 1.5); purple dots depict low expression genes (BH adjusted p < 0.01 and fold change ≤ -1.5). (C) Unsupervised heatmap plot of 4485 significantly altered genes at baseline illustrating genes involved in oxidative phosphorylation, interferon signaling and pattern recognition receptors. (D) Principal component plot (30,013 genes) of LPS-treated (2 and 8 hours) HIVEP1 deficient cells and controls showing clear clustering. (E) Volcano plot depicting genome-wide changes in LPS-induced gene expression (corrected for baseline differences) of HIVEP1 deficient cells relative to controls at 2 hours. (F) Volcano plot illustrating transcriptomic differences in LPS-induced gene expression (baseline corrected) of HIVEP1 deficient cells relative to controls at 8 hours. (G) Heatmap representation of genes involved in Toll-like receptor and NF-kB signaling in LPS-treated samples. (H) Dot plots depicting z-scores against GC content of transcription factor binding site enrichment analysis.

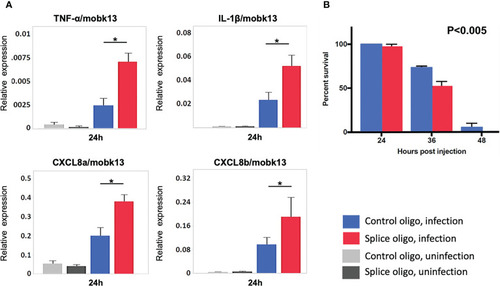
HIVEP1 knockdown increases systemic inflammation and impairs survival in zebrafish embryos with sepsis. (A) RNA expression of inflammatory cytokines normalized to mobk13 measured by RT-qPCR. Zebrafish embryos (n = 10) were pooled into one biological replicate and five independent experiments were performed. Data shows mean ± SEM (B) The survival rate was significantly lower in the HIVEP1 splice morpholino injected group than that in control (n = 20 per group). Data shows means ± SEM. Experiment performed in triplicate. Survival rates were compared using log-rank statistics. *P < 0.005.

Acknowledgments
This image is the copyrighted work of the attributed author or publisher, and ZFIN has permission only to display this image to its users. Additional permissions should be obtained from the applicable author or publisher of the image. Full text @ Front Immunol