
- Title
-
Quantitative spatial and temporal assessment of regulatory element activity in zebrafish
- Authors
- Bhatia, S., Kleinjan, D.J., Uttley, K., Mann, A., Dellepiane, N., Bickmore, W.A.
- Source
- Full text @ Elife

Diagramatic representation of the Q-STARZ pipeline. (A). Top: map of the landing pad vector. Bottom: scheme for generating stable transgenic ‘landing lines’. The landing pad vector is co-injected with Tol2 mRNA into one-cell stage wild-type embryos. Tol2-mediated recombination integrates the landing pad containing phiC31-attB sites flanking the tracking cis-regulatory element (CRE)-reporter cassette (SHH-SBE2, a CRE driving eGFP in the developing forebrain) at random locations in the zebrafish genome. F0 embryos showing mosaic eGFP expression are raised to adulthood. F1 embryos obtained by outcrossing F0 lines with wild-type zebrafish are screened for tracking CRE-driven reporter (eGFP) expression. Embryos where eGFP expression was only observed in the expected activity domain (forebrain) of the tracking CRE were raised to adulthood to establish stable ‘landing lines’. (B) Top: map of the dual-CRE dual-reporter vector. Bottom: scheme for replacing the tracking cassette in the landing line with the dual-CRE dual-reporter cassette containing the enhancers to be assayed for spatiotemporal activity. Assay vector and mRNA coding for phiC31 integrase are injected in one cell stage embryos derived from outcrossing F1 landing line with wild-type fish. Injected embryos were selected for loss of tracking CRE (SHH-SBE2)-driven eGFP fluorescence in forebrain and mosaic expression of both eGFP and mCherry resulting from the test CREs in the assay cassette. F0 transgenic lines were established from selected embryos and eGFP and mCherry expression imaged in F1 embryos derived from outcrossing these lines with wild-type fish. Signals from both reporters were observed in the activity domains of both CREs in F1 embryos bearing the assay constructs with ‘neutral’ sequence between the two CRE-reporter units (yellow signal seen in expressing tissues in the merge channel). However, eGFP and mCherry expression was restricted to tissues where the associated CREs are active upon inclusion of three copies of the chicken β-globin 5′HS4 (3XcHS4) insulator between the two CRE-reporter units.
|

(A) Top: schematic of the design of the landing pad bearing SHH-SBE2 as the tracking cis-regulatory element (CRE). Below: CRE activity observed exclusively in the forebrain in F1 embryos with the SHH-SBE2-eGFP tracking cassette. Images shown for pool of F1 embryos (scale bar = 1000 μm) and individual embryos (scale bar = 100 μm) at different stages of embryonic development. FB, forebrain; hpf, hr post fertilisation. Scale bar = 100 μm. (B) Unique bands (*) observed in round 2 of PCR amplification of DpnI digested genomic DNA from F1 embryos bearing the landing pad cassette. (C) Ensembl Genome Browser snapshot depicting the integration site (red arrow) of the SHH-SBE2 landing pad and sequencing data from clones bearing the PCR product shown by * in (B).
|

Constructs carrying well-characterised CREs from the PAX6 locus (PAX6-7CE3, hindbrain enhancer, and PAX6-SIMO, lens enhancer). (A) Confocal images of 96hpf F1 embryos derived from founder lines injected with the cassettes indicated above each image panel. Top two panels show dye-swap experiment (eGFP and mCherry reporters swapped between the two CREs) with a neutral sequence (–, no insulator activity) between the two CRE-reporter cassettes. eGFP and mCherry expression is observed in both lens and hindbrain indicating complete crosstalk between 7CE3 and SIMO CREs. Bottom panel: inclusion of three copies of the well-characterised chicken β-globin 5′HS4 (3XcHS4) insulator restricts the activities of each enhancer to their respective specific domains. Scale bars = 100 μm. (B) Average of mean fluorescence intensities ratios (G/C: eGFP/mCherry; C/G: mCherry/eGFP) in the lens and hindbrain at 72 and 120 hr post fertilisation (hpf) in F1 embryos derived from founders bearing constructs without (–) or with 1×, 2× or 3× insulator sequences. Each bar indicates average of ratios of mean fluorescence intensities from at least five independent images of embryos bearing the assay construct indicated (n ≥ 5, error bars indicate standard deviation). A highly significant difference in fluorescence intensity ratios (computed by two-tailed Student’s t-test) was observed between embryos at the same stage of development harbouring constructs with no insulator (–) and those with three copies of the insulator (3xI). This demonstrates that fluorescence is progressively restricted to the tissue where the associated CRE is active as the number of copies of the insulator increases. Raw data used for plotting the graphs are provided in Figure 3—source data 1. L, Lens; H, hindbrain, ****p<0.0001, ***p<0.001, **p<0.01.
|
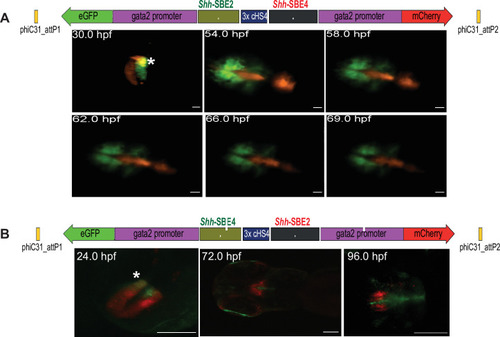
(A) Top: schematic of assay construct with two enhancers from the mouse Shh locus active in developing forebrain (Shh-SBE2 and Shh-SBE4 driving eGFP and mCherry respectively). Below: snapshots of live imaging of F1 embryos derived from transgenic lines bearing the assay construct. Distinct as well as overlapping domains (marked by *) of activities are observed for the two cis-regulatory elements (CREs) in early stages of development, until about 54 hr post fertilisation (hpf). At later stages of embryonic development, the activities of the two forebrain CREs are observed in completely distinct domains. Scale bar = 100 μm. (B) As in (A) but with a dye-swap, that is, Shh-SBE2 driving mCherry and Shh-SBE4 driving eGFP.
|

Dye swap experiment with SHH-SBE2 enhancer wild-type Wt(C) allele and Mut(T) allele bearing a holoprosencepaly- associated mutation (A: Wt(C)-eGFP/ Mut(T)-mCherry; B: Wt(C)-mcherry/ Mut(T)-eGFP).Top: Schematic representation of the test construct indicating the reporter genes driven by the two alleles. Bottom: confocal images and histogram of average of mean fluorescence intensities ratio (A:eGFP/mCherry; B:mcherry/eGFP) in the rostral (RH) and caudal (CH) hypothalamus for F1 embryos derived from founder lines bearing the test construct described (n≥5, error bars indicate standard deviation). At earlier stages of development (28-36 hpf, no significant difference in activity was observed between the two alleles). However at later stages of development (48 hpf and 72h pf) the mutant allele failed to drive reporter gene expression in the RH, and had significantly weaker activity in the CH at 72 hpf. Raw data used for plotting the graphs is provided in Figure 5—source data 1. ****p<0.0001, **p<0.01 (computed by two-tail student t-test). Scale bar = 100 μm.
|