
- Title
-
A cerebellar internal model calibrates a feedback controller involved in sensorimotor control
- Authors
- Markov, D.A., Petrucco, L., Kist, A.M., Portugues, R.
- Source
- Full text @ Nat. Commun.

Closed-loop experimental assay to study optomotor behavior in larval zebrafish.
a When a larval zebrafish swims forward with respect to its visual environment (left), the environment moves backwards with respect to the fish (right). Variables expressed in motor coordinates, such as tail movement and resulting position or velocity of the swimming larva, are presented in green. Variables expressed in sensory (visual) coordinates, such as observed position or velocity of the visual environment, are presented in magenta. This color-code is used throughout the figures. b Change in position and velocity of a swimming fish with respect to its visual environment (left) and of the environment with respect to the swimming fish (right). In all figures, decrease of environment position and velocity along the y-axis means that fish progresses forward with respect to the environment. Swimming-elicited change in environmental velocity is referred hereafter as visual reafference, in contrast with externally-generated changes in velocity, referred as exafference. c Behavioral rig (left) and schematics of the closed-loop experimental assay (right) used to induce OMR and to provide visual reafference to the fish. Scale bar: 1 mm. d Raw data recorded during one experimental trial. b, d vertical shaded bars indicate swimming bouts. |
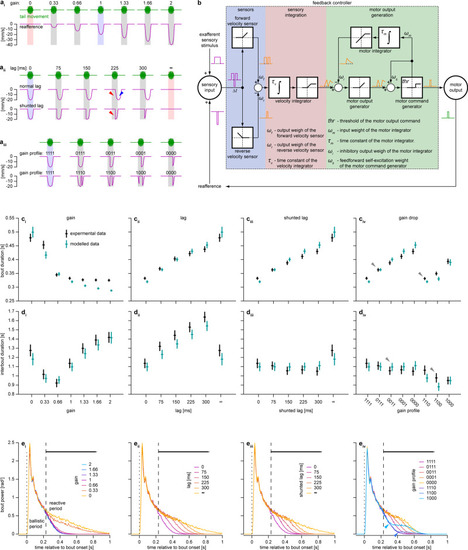
Acute reaction to unexpected perturbations in visual feedback can be implemented by a feedback controller.
a Reafference conditions used to induce acute reaction: gains (i), lags (ii), and gain drops (iii). Vertical shaded bars indicate swimming bouts, blue and red bars indicate normal reafference and open-loop conditions, respectively. Red triangles indicate insufficient reafference in the beginning of the bout, blue triangle indicates excessive reafference after the bout offset. Gain drop conditions (aiii) are labeled by four digits indicating the gain during the corresponding bout segments (e.g., condition 1100 has normal reafference during the first 150 ms of the bout but no reafference for the next 150 ms). b Feedback control model of acute reaction. White squares depict mathematical operations performed by respective nodes: integration, rectification, saturation, and thresholding. Magenta and green traces represent input and output of the model, orange traces represent output of respective nodes. Seven small Greek letters and |

Larval zebrafish are able to integrate the optic flow.
a Light-sheet microscope combined with a behavioral rig used in the whole-brain functional imaging experiments. b Spatial distribution of detected ROIs from six larvae. Color indicates percentage of larvae with ROIs in the corresponding voxel of the reference brain. b, f, j Maximum dorsoventral or lateral projections are shown: ro rostral direction, l left, r right, c caudal, d dorsal, v ventral; fb forebrain, mb midbrain, hb hindbrain (see Supplementary Fig. 2 for anatomical reference); scale bars: 100 µm. Dotted black curves outline the dorsal rostrolateral midbrain that was blocked from the scanning laser by the eye-protecting screens. Colored circles indicate location of example ROIs shown in the figure, images on the right show their shape (scale bar: 10 µm). c Z-scored fluorescence of sensory and motor example ROIs in one trial. b–f Magenta and green colors represent sensory and motor ROIs, respectively. Vertical shaded bars indicate bouts. Gray triangle indicates the response of the sensory ROI to the grating motion, black triangle indicates the response of the motor ROI after the first bout onset. d Average grating-triggered and bout-triggered fluorescence of example ROIs presented in c. d, h Shaded areas represent SEM across triggers. e Average grating-triggered and bout-triggered fluorescence of all sensory and motor ROIs pooled from all imaged larvae. f Spatial distribution of sensory and motor ROIs. f, j color indicates percentage of larvae with ROIs from respective functional group in the corresponding voxel of the reference brain, color map is the same as in b. g Z-scored fluorescence of two sensory ROIs in one trial: one with short integration time constant and one with long. b, g–j Blue and red colors represent sensory ROIs with short and long time constants, respectively. h Average grating-triggered fluorescence of example ROIs presented in g. i Average grating-triggered fluorescence of all sensory ROIs. Inset shows distribution of time constants of sensory ROIs (mean ± SEM across larvae). j Spatial distribution of all sensory ROIs with short and long time constants. |

Larval zebrafish adapt their behavior in response to a long-lasting perturbation in visual reafference.
a Four phases of the long-term adaptation protocol: calibration, pre-adaptation, adaptation, and post-adaptation. Two groups were tested: normal-reafference control (N = 103) and lag-trained larvae (N = 100), who received lagged reafference during the adaptation phase (red trace). b Tail traces from eight trials in a lag-trained fish. Dotted lines show when the grating was moving forward. Vertical shaded bars indicate first swimming bout in each trial. Blue arrow indicates increase of first bout duration in the beginning of the adaptation phase (acute reaction), cyan arrow indicates decrease of bout duration by the end of the adaptation phase (reduction of acute reaction), and orange arrow indicates decrease of bout duration in the post-adaptation phase (after-effect). c First bout duration in each trial (mean ± SEM across larvae). d–f Quantification of acute reaction (d) and long-term adaptation effects: reduction of acute reaction (e) and the after-effect (f). Each dot represents first bout duration in one fish, averaged across ten trials and normalized by subtracting the value from the pre-adaptation phase (d, f) or from the first ten trials of the adaptation phase (e). d–j Median and interquartile range across larvae are shown, n.s. p ≥ 0.05, *p < 0.05, **p < 0.01 (d 7.92 × 10⁻²¹, e 1.25 × 10⁻⁶, f 0.02, h 0.88, i 6.66 × 10⁻²², j 0.27; Mann–Whitney U-test with two-tailed alternative). Red dots represent example fish shown in b. g First bout power profile in different experimental phases of normal-reafference control (i) and lag-trained larvae (ii), averaged within blocks of ten trials in each larva. Dashed lines separate ballistic and reactive periods. Thick horizontal colored lines indicate time points, at which mean bout power is different from the pre-adaptation level (Wilcoxon signed rank test, p < 0.05/220, where 220 is the total number of tested time points). Black arrows indicate increase of ballistic power during the experiment. h–j Quantification of the change in mean bout power during the experiment: acute reaction of ballistic bout power (h), of reactive bout power (i), and the after-effect in ballistic bout power (j). Each gray dot represents the area below the first bout power curve in one fish, computed over its respective bout period, averaged across ten trials and normalized by subtracting the value from the pre-adaptation phase. |

Long-term adaptation, but not acute reaction, is impaired after PC ablation.
a Experimental flow of PC ablation experiments. b First bout duration in each trial of the long-term adaptation experiment in treatment control larvae (i N = 85 and 85 for normal-reafference control and lag-trained groups, respectively) and PC-ablated larvae (ii N = 83 and 90). Solid lines and shaded areas represent mean ± SEM across larvae. b–e Blue arrows indicate acute reaction, cyan arrows indicate reduction of acute reaction, and orange arrow indicates the after-effect. c–e Quantification of acute reaction (c) and long-term adaptation effects: reduction of acute reaction (d) and the after-effect (e). Each gray dot represents first bout duration in one fish, averaged across ten trials and normalized by subtracting the baseline value obtained during the pre-adaptation phase (c, e) or during the first 10 trials of the adaptation phase (d). c–e, g Black and red lines represent median and interquartile range across larvae. f, Mean bout power profiles of the treatment control (i) and PC-ablated groups (ii). from pre-adaptation and post-adaptation phases of the experiment. First bout power profiles were averaged within respective blocks of ten trials in each larva. Colored curves and shaded areas represent median and interquartile range across larvae. Dotted lines indicate bout onsets, dashed lines separate ballistic and reactive periods. Thick horizontal orange lines indicate time points at which mean bout power during the post-adaptation trials is different from the baseline pre-adaptation bout power (Wilcoxon singed rank test, p < 0.05/220, where 220 is the total number of time points, two-tailed alternative). Black arrows indicate increase of ballistic power during the experiment. Data from normal-reafference control and lag-trained animals were pooled together as no effect of reafference condition on increase in ballistic bout power was observed (Fig. 4j). g Quantification of the change in mean ballistic bout power during the experiment. Each gray dot represents area below the first bout power curve in one fish, computed over the ballistic period, averaged across ten trials and normalized by subtracting the baseline value obtained during the pre-adaptation phase. c–e, g n.s. - p ≥ 0.05, *p < 0.05, **p < 0.01 (c: treatment control: 8.83 × 10⁻⁷, PC-ablated: 1.52 × 10⁻¹⁴, lag-trained: 0.18 × 10⁻²; d treatment control: 0.046, PC-ablated: 0.61, lag-trained: 0.35; e treatment control: 0.47, PC-ablated: 0.58, lag-trained: 0.45; g 0.68 × 10⁻²; Mann–Whitney U-test with two-tailed alternative). |

Activity of a subpopulation of PCs can represent the output of an internal model.
a Light-sheet microscope combined with a behavioral rig used for PC imaging. Inset shows location of two example ROIs shown in d. Scale bar: 100 µm; ro rostral direction, l left, r right, c caudal. b Modified long-term adaptation protocol. c First bout duration in each trial in normal-reafference control larvae (N = 8), lag-trained non-adapting larvae (N = 8), and lag-trained adapting larvae (N = 9), mean across larvae is shown. d Imaging data processing flow shown for two example ROIs (see details in text). di Z-scored fluorescence in five trials. Vertical shaded bars indicate first swimming bout in each trial. dii First-bout-triggered fluorescence. diii First-bout-triggered responses in each trial. Thick lines represent box-filtered responses, with a filter length of nine trials. div Four criteria that represent change in bout-triggered responses during important transitions of the experimental protocol. dv Criteria converted into 4-digit ternary barcodes. dvi First-bout-triggered fluorescence averaged across respective blocks of ten trials. e Clustering of ROIs using barcodes. ei Barcodes of all ROIs pooled from imaged larvae. eii Within-fish fractions of ROIs assigned to different clusters. Only clusters containing, on average, at least 2% of ROIs in at least one experimental group are shown. Magenta rectangles indicate 0-0 + cluster, which was the only cluster that was significantly enriched in lag-trained adapting larvae (*p = 0.011; Kruskal–Wallis test). fi (top), First-bout-triggered responses of all 0-0 + ROIs pooled from lag-trained adapting larvae. fi (bottom), First-bout-triggered responses of 0-0 + ROIs, averaged within each lag-trained adapting larva. Solid line and shaded area represent mean ± SEM across larvae. fii First-bout-triggered fluorescence of 0-0 + ROIs, averaged across respective blocks of ten trials and across ROIs within each lag-trained adapting larva. Colored lines and shaded areas represent mean ± SEM across larvae. |

A cerebellar internal model calibrates a feedback controller involved in sensorimotor control.
a Probability distribution of differences in time constants of sensory ROIs (end of adaptation—beginning of the adaptation). Histograms were smoothed using a kernel function with width of 0.1 s. Dotted lines denote mean probability values, shaded areas denote SEM across larvae (normal-reafference control, N = 12, lag-trained non-adapting, N = 13, and lag-trained adapting, N = 6). b Anatomical location of sensory ROIs that decreased their time constants by more than 0.4 s (see Supplementary Fig. 2 for anatomical reference). c Schematic diagram of the feedback controller that can implement acute reaction to unexpected perturbations in reafference. Cerebellar internal model monitors the efference copies of motor commands and resulting sensory consequences and learns their transfer function. It calibrates some intrinsic parameters of the controller according to consistent environmental features that can be learned by an internal model. The wavy line denotes the teaching signal used by the internal model to learn the transfer function. The dotted orange arrows denote potential influence of the cerebellum over the feedback controller (modification of time constants of sensory integration, as suggested by a, and/or parameters of the pre-motor circuits). d Mapping of the crucial functional nodes involved in acute reaction and long-term adaptation onto the larval zebrafish brain. See details in the text. |