
- Title
-
Repurposing chlorpromazine for anti-leukaemic therapy by nanoparticle encapsulation
- Authors
- Tang Gundersen, E., Førde, J.L., Sjo Tislevoll, B., Leitch, C., Barratt, G., Tore Gjertsen, B., Herfindal, L.
- Source
- Full text @ Int J Pharm

CPZ shows dose-dependent cytotoxicity against AML< cell lines and patient cells. (A): AML cell lines (HL-60, OCI-AML3, MOLM-13, and MV4-11) and AML patient cells (P1-4) derived from blood or bone marrow (BM) were incubated in growth conditions for 24 or 48 h with 5, 10, or 20 µM CPZ. Cells were tested for viability as measured by metabolic conversion of the WST-1 reagent, described in detail in the Methods section. CPZ dose–response curves of MOLM-13 cells and cells from blood of patient P1 are shown in (B) and (C) respectively. (D): AML cell lines incubated with 10, 20, or 40 µM CPZ for 24 h were tested for viability using Annexin/PI viability. (E): Flow cytometric dot plots of Annexin/PI viability assay of MOLM-13 cells. Cell were seeded to 2.0 × 10⁵ cells/ml. All experiments were performed in triplicate. |

CPZ exhibits synergistic activity with several anti-AML drugs. MOLM-13 cells were incubated for 24 h with CPZ (10 µM) alone, or with either EME (50 or 120 nM) (A) or VPA (1.0 or 1.5 mM) (B) and viability measured by metabolic conversion of the WST-1 reagent. (C): Coefficient of drug interaction (CDI) was calculated as described in the Methods section (see Eq. (5)). A CDI < 1 indicates synergism, a CDI = 1 indicates additivity, and a CDI > 1 indicates antagonism. Results are from a triplicate experiment. Asterisks *, **, and *** indicate p ≤ 0.05, ≤ 0.01, and ≤0.001, respectively, from ANOVA Oneway (Bonferroni) statistical analysis (A,B) and one-sample two-sided t-test (C). |
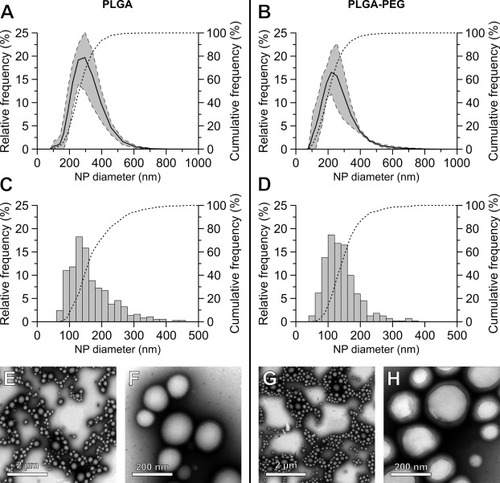
Size distribution and morphology of CPZ-loaded PLGA and PLGA-PEG nanoparticles. (A,B): DLS measurements for the diameter of CPZ-loaded PLGA (A) and PLGA-PEG (B) nanoparticles. Each graph shows the average count-based distribution in size (d.nm) of three separate nanoparticle batches, analysed by DLS within 3 h of production. The dashed lines indicate the standard deviation and the dotted line represent the cumulative distribution. (C-H): Freshly prepared CPZ-loaded nanocarriers were stained with uranyl acetate and imaged with TEM. (C,D): Analysis of TEM images for the size distribution (d.nm) of nanoparticles made with PLGA (C) and PLGA-PEG (D). The dotted lines indicate the cumulative distribution frequency. TEM images are shown of CPZ-loaded PLGA (E,F) and PLGA-PEG (G,H). Scale bars represent either 2 µm (E,G) or 200 nm (F,H). |

Good shelf-life of nanocarriers is demonstrated by size stability and limited drug release. Freshly prepared batches of CPZ-loaded PLGA and PLGA-PEG were resuspended in PBS at pH 7.4 (A) or pH 9.5 (B,C), and kept at 4 °C in the dark and in sealed glass containers. Samples were taken at given time points and analysed for size (A,B) using DLS, and drug release (C) using HPLC as described in the Methods section. The release data represents the ratio of CPZ found in the pellet (nanoparticles) and supernatant (free form), after separation by centrifugation. The data show the average and standard deviation from three separate batches for each formulation. |

Permeability of CPZ is significantly reduced by nanocarrier encapsulation. Free or encapsulated CPZ was diluted in pH 7.4 PBS and incubated in PAMPA plates for 5 h before analysis of CPZ well concentrations as described in the Methods section. Permeability (Pe) was calculated as described in the Methods section (see Eqs. (4)) and is provided as Log Pe. From one-way ANOVA with Bonferroni method, p < 0.001 (***) between free and encapsulated CPZ. No significant difference was found between PLGA and PLGA-PEG. The data are average and standard deviation of a triplicate experiment. |

PLGA-based nanoparticles rapidly associate with AML cells. MOLM-13 cells were incubated Nile Red-loaded nanoparticles at 2% v/v (A). After various times of incubation, cells were washed, and their fluorescence analysed with an Accuri C6 flow cytometer. The results are the average of median fluorescence, and standard deviation from a triplicate experiment. Non-linear regression curves were made using SigmaPlot, ver. 9.01, (Systat Software, Inc., San Jose, CA, USA). (B-K): Cells incubated with Nile Red-loaded nanoparticles were fixed in 2% buffered formaldehyde (in pH 7.4 PBS containing Hoechst 33342) and imaged with confocal microscopy. The scale bars in the confocal micrographs represent 15 µm. See Supplementary Figure S1 for gating strategy |
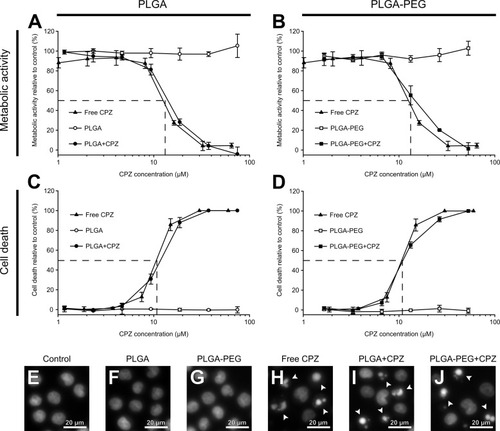
CPZ-loaded PLGA nanoparticles have equal cytotoxicity towards AML cells compared to free CPZ. MOLM-13 cells were incubated for 24 h with various concentrations of either free CPZ, empty or CPZ-loaded nanoparticles. (A,C) are data with PLGA nanoparticles, and (B,D) are with PLGA-PEG nanoparticles. The cells were incubated with the different additions for 24 h before their viability relative to control was measured by the metabolic conversion of the WST-1 reagent. Following the plate reading for WST-1, the cells were fixed in 2% buffered formaldehyde (in pH 7.4 PBS containing Hoechst 33342). Using fluorescence microscopy, cells were counted for apoptosis and adjusted for control. The data in A-D are the averages and standard deviations from triplicate experiments. (E-J): Fluorescence microscopy images of Hoechst-stained nuclei of cells after 24 h of the different treatments. Arrows indicate typical apoptotic cells. Scale bars represent 20 µm. |

CPZ-loaded PLGA/PLGA-PEG show quick but limited burst release at physiological pH and delayed cell death kinetics. Freshly prepared batches of CPZ-loaded PLGA (A) and PLGA-PEG (B) were resuspended in pH 7.4 PBS and stirred at 400 RPM and at 37 °C. Aliquots were sampled at given time-points and analysed for CPZ-content by HPLC as described in the Methods section. The release data represents the ratio of CPZ found in the pellet (nanoparticles) and supernatant (free form), after separation by centrifugation. (C, D): MOLM-13 cells were incubated for up to 12 h with 10% v/v concentration of either empty or CPZ-loaded PLGA (C) or PLGA-PEG (D) nanoparticles, or free CPZ of equivalent drug concentrations. At given time points aliquots were transferred to 2% buffered formaldehyde (in pH 7.4 PBS containing Hoechst 33342). Nuclei-stained cells were imaged with an Axiovert 200 M fluorescence microscopy and normal and apoptotic nuclei were counted. Data are from a triplicate experiment. |

Injected nanoparticles do not cross the BBB of zebrafish larvae. Zebrafish larvae were injected with 4 nl nanoparticles of PLGA (C,D) or PLGA-PEG (E,F), loaded with Nile Red fluorochrome. Injections were done into the posterior cardinal vein (indicated by arrows) on larvae aged 2 days post-fertilisation. Imaging was done with confocal microscopy 2 h and 1 day post-injection. Fluorescence images of larvae (A-F) are Z-projections obtained by summation of overlying pixels in the confocal Z-stack, and is shown in “Red hot” mode, where the fluorescence signal is gradient coloured by its intensity, ranging from red (low) to white (high). Scale bars represent 500 µm. |