
- Title
-
Nucleolar GTPase Bms1 displaces Ttf1 from RFB-sites to balance progression of rDNA transcription and replication
- Authors
- Zhu, Y., Wang, Y., Tao, B., Han, J., Chen, H., Zhu, Q., Huang, L., He, Y., Hong, J., Li, Y., Chen, J., Huang, J., Lo, L.J., Peng, J.
- Source
- Full text @ J. Mol. Cell Biol.
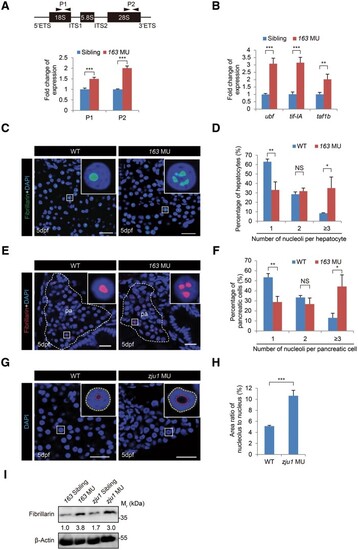
Loss-of-function of Bms1l upregulates the pre-rRNA transcription and increases the volume of nucleoli in hepatocytes. (A) qPCR analysis of total rRNA transcripts in 5dpf-old bms1lsq163/sq163 mutant and its siblings (the pool of bms1+/+ and bms1sq163/+, used thereafter) using two pairs of primers derived from 18S (P1) and 28S (P2) showing an upregulation of rRNA expression in bms1lsq163/sq163 mutant. Upper panel, a diagram showing the genomic structure of the zebrafish rDNA gene and the positions of P1 and P2. (B) qPCR analysis showing the upregulation of ubf, tif-IA, and taf1b expression in 5dpf-old bms1lsq163/sq163 mutant compared with the siblings. The qPCR values were normalized against GAPDH and expressed as fold change of expression. The values plotted represent mean ± SEM. **P < 0.01, ***P < 0.001. (C–F) Fibrillarin immunostaining and DAPI staining (green in C and red in E) showing the significant increase in the number of nucleoli in bms1lsq163/sq163 hepatocytes (D, three WT embryos, 1397 cells examined; three bms1lsq163/sq163 embryos, 1274 cells examined) and pancreatic cells (F, three WT embryos, 1015 cells examined; three bms1lsq163/sq163 embryos, 463 cells examined) when compared with WT, respectively, at 5dpf. The pancreatic region (pa) was outlined by a dashed line. Scale bar, 20 μm (C) and 10 μm (E). (G and H) DAPI staining (G) showing the significant increase in the size of nucleolus in bms1lzju1/zju1 hepatocytes compared with WT at 5dpf (H, three WT embryos, 112 cells examined; four bms1lzju1/zju1 embryos, 119 cells examined). Scale bar, 20 μm. (I) Western blotting showing the upregulation of Fibrillarin protein levels in 5dpf-old bms1lsq163/sq163 and bms1lzju1/zju1 mutants compared with their siblings. β-Actin: loading control. Insets in C, E, and G showing higher magnification of a representative nucleus (boxed). The values in D, F, and H plotted represent mean ± SEM. *P < 0.05, **P < 0.01, ***P < 0.001; NS, no significance. |
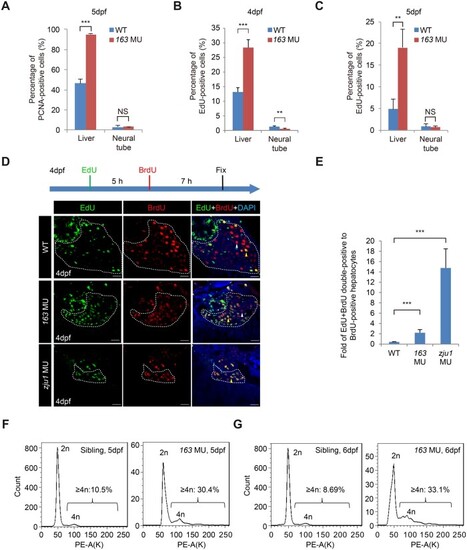
Bms1l mutations cause genomic DNA partial over-replication and arrest cells at the S-phase. (A) Immunostaining of PCNA showing the significant increase in the percentage of PCNA-positive cells in bms1lsq163/sq163 hepatocytes but not in the NT when compared with WT at 5dpf. Hepatocyte samples: three WT embryos, 3090 cells counted; three bms1lsq163/sq163 embryos, 1336 cells counted. For NT cells, the pixels of PCNA-positive and DAPI-positive signals were captured by Photoshop and were used to obtain the percentage of PCNA-positive cells as shown. (B and C) The percentage of EdU-positive hepatocytes were significantly higher in bms1lsq163/sq163 than in WT both at 4dpf (B) and 5dpf (C). Hepatocyte samples in B: four WT embryos, 9422 cells counted; three bms1lsq163/sq163 embryos, 1958 cells counted. In C: four WT embryos, 7995 cells counted; three bms1l163/sq163 embryos, 1684 cells counted. (D and E) EdU and BrdU were sequentially injected into 4dpf embryos as shown (D, top panel). Staining of EdU and BrdU was performed (D, lower panels). The ratios of BrdU + EdU double-positive vs. BrdU-only-positive hepatocytes were significantly higher in bms1lsq163/sq163 and bms1lzju1sq163 mutants than in WT at 4dpf (E), demonstrating DNA over-replication in the two mutants. Samples: five WT embryos, 2591 cells counted; seven bms1l163/sq163 embryos, 1245 cells counted; four bms1lzju1/zju1 embryos, 593 cells counted. Scale bar, 20 μm. (F and G) Flow cytometry analysis showing a significant increase in the ratio of ≥4n hepatocytes in bms1lsq163/sq163 compared with its siblings (the pool of bms1+/+ and bms1sq163/+) at 5dpf (F) and 6dpf (G). Average percentages of ≥4n hepatocytes from three repeats for each genotype were provided. PE-A(K), signal intensity in PE channel. In A‒C, E, and F, **P < 0.01, ***P < 0.001; NS, no significance. |
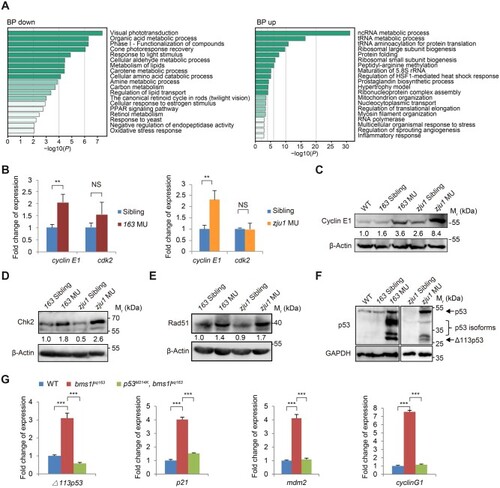
Bms1l mutations activate DNA-damage response. (A) GO enrichment analysis of the biological process (BP) category of RNA-seq data from WT and bms1lzju1/zju1 mutant embryos at 3dpf. BP up, enrichment of upregulated genes; BP down, enrichment of downregulated genes. (B) qPCR analysis showing the elevated expression of cyclin E1 but not cdk2 in both bms1lsq163/sq163 and bms1lzju1/zju1 mutants at 5dpf. (C–F) Western blotting showing that the protein levels of Cyclin E1 (C) and DNA-damage response markers Chk2 (D), Rad51 (E), p53 and p53 isoforms (F) were obviously increased in both bms1lsq163/sq163 and bms1lzju1/zju1 compared with their siblings or WT at 5dpf. β-Actin and GAPDH: loading control. (G) qPCR analysis of the expression of △113p53, p21, mdm2, and cyclinG1 in 5dpf-old bms1lsq163/sq163 mutant, bms1lsq163/sq163p53M214K/M214K double-mutant and WT. The upregulated expression of these four genes in the bms1lsq163/sq163 mutant was restored to the WT level in bms1lsq163/sq163p53M214K/M214K double-mutant. 163 MU, bms1lsq163/sq163; zju1 MU, bms1lzju1/zju1. In B and G, **P < 0.01, ***P < 0.001; NS, no significance. |
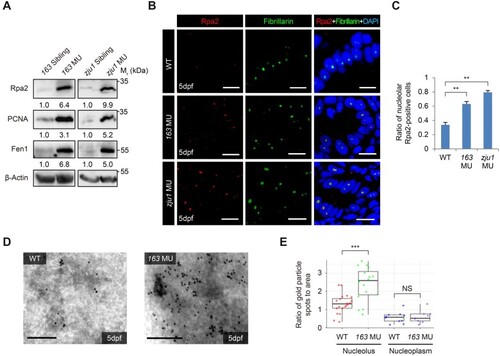
Bms1l mutations cause replication fork stall. (A) Western blotting showing a drastic increase of Rpa2, PCNA, and Fen1 protein levels in 5dpf bms1lsq163/sq163 and bms1lzju1/zju1 mutants compared with their siblings. β-Actin: loading control. (B and C) Coimmunostaining of Rpa2 and Fibrillarin in gut epithelia was performed (B). The ratio of the nucleolar Rpa2-positive cells was significantly higher in bms1lsq163/sq163 and bms1lzju1/zju1 mutants than in WT at 5dpf (C). Samples: two WT embryos, 544 cells examined; three bms1l163/sq163 embryos, 845 cells examined; two bms1lzju1/zju1 embryos, 277 cells examined. Scale bar, 10 μm. (D and E) Representative images showing Immuno-TEM of Rpa2 in hepatocytes dissected from the WT and bms1lsq163/sq163 embryos at 5dpf (D). Statistical analysis showing a significant accumulation of Rpa2-positive gold particles in the nucleoli but not in the nucleoplasm in bms1lsq163/sq163 hepatocytes compared with WT (E). For each genotype, 17‒20 nucleoli were examined. Each dot represents the ratio of gold particle numbers against area of the nucleolus or nucleoplasm in one cell. Scale bar, 0.2 μm. In C and E, **P < 0.01, ***P < 0.001; NS, no significance. |
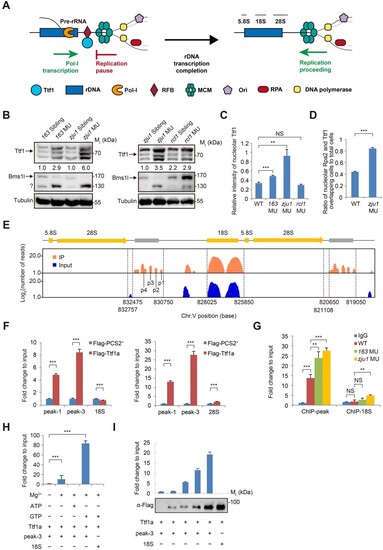
Ttf1 is accumulated on its binding sites in bms1l mutants. (A) A drawing to illustrate the head-on conflict between rDNA transcription and replication during the S-phase in higher eukaryotes. Binding of Ttf1 to the RFB-site prevents the conflict. Once the transcription is completed, Ttf1 is proposed to leave the RFB-site to allow progression of the replication fork; however, how Ttf1 is dissociated from the RFB-site remains unknown. (B) Western blotting showing an increase of Ttf1 protein level in bms1lsq163/sq163 and bms1lzju1/zju1 but not in rcl1−/− compared with their corresponding siblings at 5dpf. Tubulin: loading control. ?: unknown protein. (C) Signal intensity of nucleolar Ttf1 in the gut epithelia was significantly higher in bms1lsq163/sq163 and bms1lzju1/zju1 than in WT and rcl1−/−. Samples: three WT embryos, 364 cells counted; three bms1lsq163/sq163 embryos, 183 cells counted; three bms1lzju1/zju1 embryos, 98 cells counted; three rcl1−/− embryos, 176 cells counted. (D) Ratio of the nucleoli displaying intervening signals of Ttf1 and Rpa2 in the gut epithelia was significantly higher in bms1lzju1/zju1 than in WT. Samples: three WT embryos, 264 cells examined; three bms1lzju1/zju1 embryos, 140 cells examined. (E) ChIP‒seq identification of Ttf1-binding sites (peak-1 to peak-4) downstream of the 3ʹ-end of rDNA gene on chromosome 5 (Chr.V). (F) ChIP‒qPCR analysis showing the strong binding of Flag-tagged Ttf1a to peak-1 and peak-3 but not to the 18S (left panel) or 28S (right panel) rDNA. (G) Endogenous Ttf1 showed significant enrichment on its binding sites (ChIP-peak: peak-1 to peak-4) in bms1lsq163/sq163 (163 MU) and bms1lzju1/zju1 (zju1 MU) than in WT at 3dpf. IgG and ChIP-18S: negative controls. (H and I) ChIP‒qPCR analysis showing that, in the presence of Mg2+, the binding of purified Ttf1a to peak-3 depends on GTP but not ATP (H) and is correlated to the dosage of purified Ttf1a (I). Lower panel in I: Ttf1a was examined by western blotting. In C, D, and F‒H, **P < 0.01, ***P < 0.001; NS, no significance. |
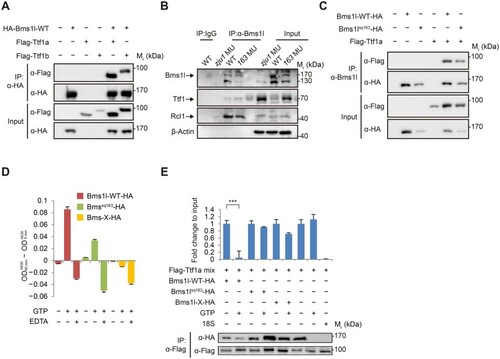
Bms1l interacts with Ttf1 and displaces Ttf1 from DNA-binding site with its GTPase activity. (A) Co-IP analysis showing that the overexpressed Bms1l (Bms1l-WT-HA) interacts with both Ttf1a and Ttf1b (Flag-tagged). Total protein was extracted from 293 T cells at 48 h after transfection with corresponding plasmids as shown and was subjected to Co-IP using an HA-tag antibody. (B) Co-IP analysis showing the successful pulldown of endogenous Ttf1 and Rcl1 by endogenous Bms1l or Bms1l163. β-Actin: loading control. (C) Co-IP analysis showing that the overexpressed Ttf1a (Flag-tagged) interacts with both Bms1l and Bms1l163 (HA-tagged). Total protein was extracted from 293 T cells at 48 h after transfection with corresponding plasmids as shown and was subjected to Co-IP using an anti-Bms1l antibody. (D) GTPase activity assay using purified proteins showing that Bms1l-X-HA is enzymatically inactive, while Bms1lsq163-HA exhibits ∼43% of Bms1l-WT-HA activity. Free phosphate concentration in each reaction was obtained by A630 color absorbance at 5 and 60 min, respectively. The subtracted value between 60 and 5 min is presented as the relative GTPase activity. (E) ChIP‒qPCR analysis for the effect of Bms1l on dissociation of the Ttf1a‒DNA complex. Purified Ttf1a was mixed with the peak-3 DNA and 10 µM GTP (Flag-Ttf1a mix). The mixture was then incubated with purified Bms1l-WT, Bms1l-163, or Bmsl1-X with or without 50 µM GTP for 60 min. Only Bms1l-WT-HA obviously dissociates the Ttf1a‒DNA complex. Lower panels: the Co-IP products (Ttf1a, Bms1l, or derivatives) were examined by western blotting with respective antibodies. ***P < 0.001. |

Knockdown of human BMS1 causes DNA over-replication and nucleolar accumulation of RPA2. (A) Western blotting of human BMS1 and RPA2 in HeLa cells showing that knockdown of BMS1 by siBMS1#3 and siBMS1#6 treatment obviously increases the level of RPA2 compared with siControl (siCon) treatment at 96 h. Tubulin: loading control. (B) Flow cytometry analysis of BrdU/PI double-labeled cells at 96 h after siRNA transfection showing that knockdown of human BMS1 arrests cells at the S-phase. Frame: ratio of cells at S-phase; PI-A, PI intensity; FITC-A, BrdU intensity. (C) Statistical analysis showing a nucleolar enrichment of RPA2 after siBMS1#3 and siBMS1#6 treatment. (D) Flow cytometry analysis of BrdU/PI double-labeled cells showing the rescue of the ratio of cells at the S-phase by Flag-BMS1R but not Flag-BMS1-163R in siBMS1#6-treated cells when compared with Flag-pCS2+. Frame: ratio of cells at S-phase. (E and F) Coimmunostaining of RPA2 and Fibrillarin (E) showing that the nucleolar enrichment of RPA2 after siBMS1#6 treatment is alleviated by Flag-BMS1R but not Flag-BMS1-163R (F). Scale bar, 5 μm. (G) Western blotting showing the upregulation of CHK2, phosph-CHK2 (T68), and TTF1 in Hela cells after BMS1 knockdown. In C and F, **P < 0.01, ***P < 0.001. |
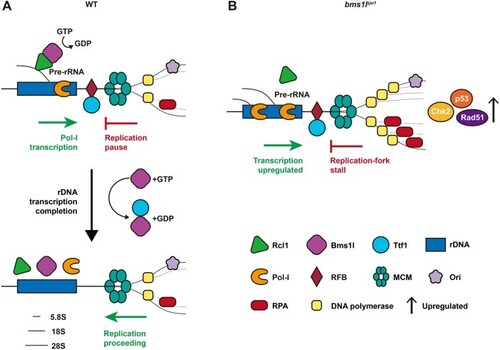
A trio by Bms1l, Rcl1, and Ttf1 resolves the head-on conflict between rDNA transcription and replication. (A) A model to propose Bms1l as a mediator in balancing ribosome biogenesis through interaction with Rcl1 and replication fork progression through interaction with Ttf1. (B) Compromising Bms1 function not only impairs ribosome biogenesis but also accumulates Ttf1 on RFB-sites to cause replication fork stall together with genomic DNA partial over-replication and cell cycle arrest at the S-phase. |