
- Title
-
Cross-species analysis of enhancer logic using deep learning
- Authors
- Minnoye, L., Taskiran, I.I., Mauduit, D., Fazio, M., Van Aerschot, L., Hulselmans, G., Christiaens, V., Makhzami, S., Seltenhammer, M., Karras, P., Primot, A., Cadieu, E., van Rooijen, E., Marine, J.C., Egidy, G., Ghanem, G.E., Zon, L., Wouters, J., Aerts, S.
- Source
- Full text @ Genome Res.

Comparative epigenomics reveals conservation of two main melanoma states. (A) Evolutionary relationship between the six studied species, represented by a phylogenetic tree (NCBI taxonomy tree). ATAC-seq profiles of the 26 melanoma cell lines are shown for three regulatory regions. (B) ATAC-seq profiles of the human melanoma lines for the SOX10 locus. Lines are colored by the melanocytic (MEL, in blue) or mesenchymal-like (MES, in orange) melanoma state. (C) Total number of ATAC-seq regions observed across all samples of a species are colored based on whether they are not alignable, alignable, or conserved accessible in human. (D) PCA clustering based on the accessibility of the 29,619 alignable regions across all six species. (E) ATAC-seq profiles of MEL and MES lines of different species for an intronic MLANA enhancer and the upstream region of MMP3. |

Conservation of binding motifs of master regulators of MEL and MES melanoma states. ( |

DeepMEL classifies melanoma enhancers and predicts important TF binding motifs. ( |

Human-trained deep learning model applied to cross-species ATAC-seq data. (A) Performance of DeepMEL and Cluster-Buster (cbust) in classifying MEL and MES differential peaks in human and dog. (B) Percentage of MEL- and MES-predicted ATAC-seq regions across all samples in our cohort and in human melanocytes. Samples are ordered according to the ratio of the number of MES/MEL-predicted regions. (C) Pearson's correlation of deep layer scores between MEL-predicted regions near orthologous MEL genes between human and another species (Human-Species) or between MEL-predicted regions near different MEL genes within one species (Species-Species). P-values of unpaired two-sample Wilcoxon tests are reported. (D) (I) Evolutionary distance between human and other species in branch length units. (II) ATAC-seq profiles of the ERBB3 locus in the six species. MEL-specific enhancers that were predicted by DeepMEL and that were also found (gray) or not found (green) via liftOver of the human MEL enhancer are highlighted. (III) DeepExplainer plots for the multiple-aligned MEL-predicted ERBB3 enhancers. Red and blue dots represent point and indel mutations, respectively. |

Core Regulatory Complex of MEL melanoma enhancers. ( |
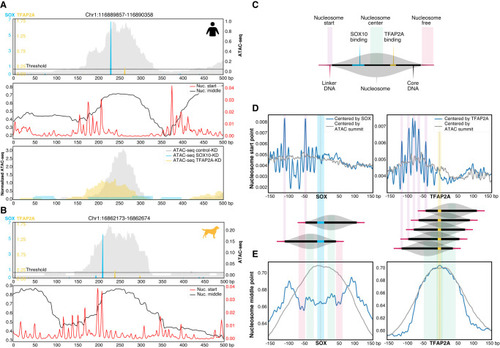
Positional specificity of SOX10 and TFAP2A in MEL melanoma enhancers. ( |

Predicting causal mutations of evolutionary changes in MEL enhancers. (A,B) Example region upstream of APPL2 that is accessible (A) and active (B) in the MEL dog line Dog-OralMel-18249 but not in human MEL lines. (C) DeepMEL prediction score of each of the 24 topics for the dog and human APPL2 enhancer. (D) Effect on topic 4 DeepMEL score on the dog sequence when in silico simulating each of the single detected point mutations between the dog and human APPL2 enhancer. (E) DeepExplainer plots of the middle 120 bp of the dog and human APPL2 enhancer. In the middle, the effect of each possible point mutation between the dog and human sequence on the MEL DeepMEL score was in silico calculated and is represented by colored dots depending on the nucleotide to which the original dog nucleotide was in silico mutated. Truly existing point mutations between the dog and human sequence are highlighted by color-coded vertical dashed lines. Four mutations that decrease the motif score of the SOX10, MITF, and TFAP2A motifs are highlighted by a gray box and are encircled. (F) Bar plot showing the mean effect on the log2 delta ATAC-seq signal of a non-human region compared to the human homolog depending on the number of SOX10 motif hits lost or gained. Only regions having no change in the number of significant TFAP2A, MITF, and RUNX motifs hits were used. The y-axis is normalized to the category with no changes in the number of significant SOX10 motif hits. The number of regions in each of the categories is mentioned (#). (G) Luciferase assay on six human or dog enhancers. Significant motif hits per enhancer are shown with colored crosses. For the luciferase assays: luciferase activity in MM001 is shown relative to Renilla signal and is log10 transformed. P-values were determined using Student's t-test, and the error bars represent the standard deviation over three biological replicates. |