
- Title
-
Nuclear S-nitrosylation impacts tissue regeneration in zebrafish
- Authors
- Matrone, G., Jung, S.Y., Choi, J.M., Jain, A., Leung, H.E., Rajapakshe, K., Coarfa, C., Rodor, J., Denvir, M.A., Baker, A.H., Cooke, J.P.
- Source
- Full text @ Nat. Commun.
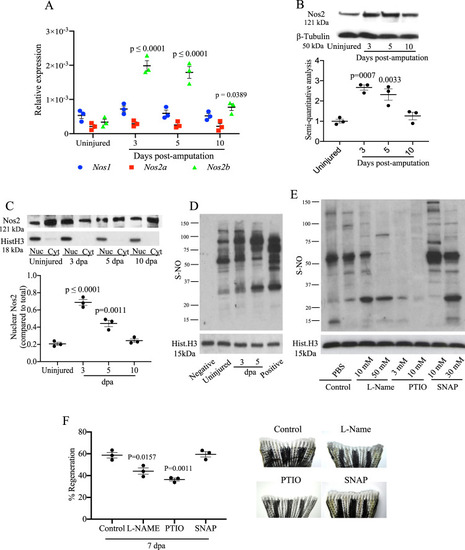
Modulation of Nos and nuclear protein S-nitrosylation during tailfin regeneration in adult zebrafish.
A Real time PCR for nos1, nos2a, and nos2b in tailfin at 3, 5, and 10 dpa. B Western blot (WB) analysis of Nos2 in tailfins at 3, 5, and 10 dpa and semi-quantitative analysis of bands. C WB analysis of Nos2 in nucleus and cytoplasm of tailfins at 3, 5, and 10 dpa. Semi-quantitative analysis of bands shows nuclear to cytoplasmic protein ratio. D WB analysis of S-nitrosylated nuclear proteins in the regenerating tailfin. S-nitrosothiols were specifically labeled with TMT. An anti-TMT antibody was used to detect S-nitrosylated proteins. Neg and Pos are respectively the negative (without ascorbic acid) and positive (with S-nitrosoglutathione) controls. E, F WB analysis of S-nitrosylated nuclear proteins in tailfin following treatment with L-NAME 10 or 50 mM, 2-Phenyl-4,4,5,5-tetramethyl imidazoline-1-oxyl 3-oxide (PTIO) 3 or 10 mM, S-Nitroso-N-acetyl-dl-penicillamine (SNAP) 10 or 30 mM, or PBS (control). The dot plot shows changes in tailfin regeneration rate, here shown at 7 dpa, following drug treatments compared to control. β-tubulin was used as loading control for total or cytoplasmic proteins. Histone H3 was used as loading control for nuclear proteins. Dpa days post-amputation. N = 3 biological replicates, one way ANOVA test followed by Bonferroni’s multiple comparisons test was used to compare the means, p values shown are vs. uninjured or control, all other comparisons are not significant. Data are presented as mean values +/− SEM. |
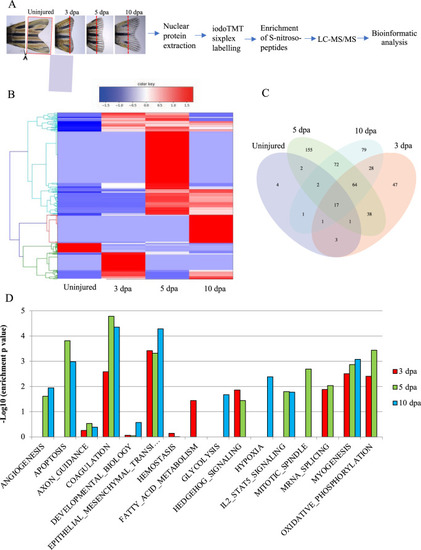
Bioinformatic analysis of the S-nitrosylome in zebrafish tailfin regeneration.
A Workflow for the analysis of the S-nitrosylome. Tailfins of zebrafish (6 months old) were amputated; regrown tissue was collected in uninjured and at 3, 5, and 10 dpa (dash red lines represent the edge of the amputation); nuclear proteins were extracted and labeled with iodoTMT, digested with trypsin, and S-nitroso-peptides enriched through anti-TMT antibody containing resin and followed by LC-MS-MS. B, C Hierarchical clustering heat map and Venn diagram showing the dynamic changes in the number of S-nitrosylated nuclear proteins during the regeneration compared to uninjured. D Hallmark pathways enrichment by the differentially expressed S-nitrosylated proteins during regeneration compared to uninjured. The significant pathways are displayed along the x-axis. Dpa day post-amputation. N = 2 biological replicates, followed by bioinformatic analysis. |

Role of S-nitrosylation of Kdm1a in tailfin regeneration in adult zebrafish.
A MS/MS fragmentation spectrum for the Cys334-containing peptide of Kdm1a. Peptide sequence is shown at the top left of the spectrum, with the annotation of the identified matched amino terminus-containing ions (b ions) in black and the carboxyl terminus-containing ions (y ions) in red. The spectrum confirms the identity of the peptides CPLYEAN and the labeled C as S-nitrosylated cysteine. B Line graph reporting the quantification of Kdm1a S-nitrosylation (normalized by total Kdm1a) and Kdm1a activity during tailfin regeneration. C Western blotting (WB) for S-nitrosylated Kdm1a in uninjured and at 3, 5, and 10 dpa. Samples were previously immunoprecipitated (IP) for Kdm1a. IP with IgG and input were used as controls. D–F WB for Kdm1a, CoRest and NuRD complexes components following IP with Kdm1a antibody in tailfin uninjured or injured at 5 dpa. Dpa days post-amputation. N = 3 biological replicates. |

Effects of kdm1a knockdown in adult zebrafish.
A Western blotting (WB) analysis of Kdm1a control and morpholino KD. Dot plot shows semiquantitative analysis of bands. Two-tailed t-test. B Effects of Kdm1a KD on tailfin regeneration. Dashed red line represents the edge of the resection. Scale bar indicates 2 mm. C Line graph showing changes in tailfin regeneration rate following kdm1a KD. Two-way ANOVA followed by Bonferroni’s multiple comparisons test. D, E WB for H3K4unme (unmethylated), H3K4me1, H3K4me2, and H3K4me3 in control uninjured, injured and injured + kdm1a KD at 5 dpa. Dot plot shows semi-quantitative analysis of bands. Histone H3 was used as loading control. Dpa days post-amputation. Two-way ANOVA followed by Bonferroni’s multiple comparisons test, p values indicate comparisons of uninjured vs. other groups. N = 3 biological replicates. Data are presented as mean values +/− SEM. |
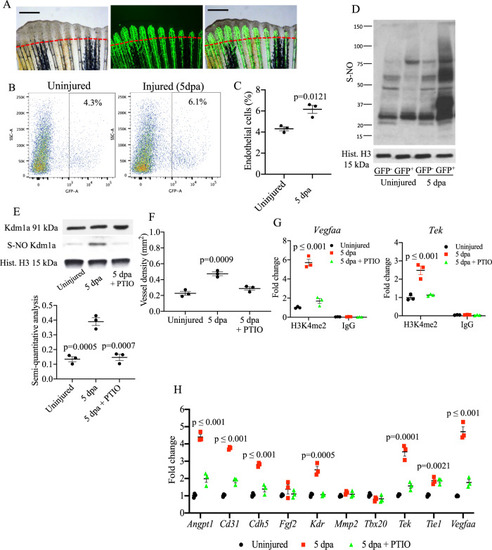
Analysis of S-nitrosylation in endothelial cells during tailfin regeneration.
A Brightfield and fluorescence images of Tg(fli1:EGFP)y1 zebrafish tailfin at 3 days post-amputation (dpa) showing formation of new vessel branches (GFP signal). Scale bar measures 500 μm. B FACS plot of GFP+ and GFP− cells in the tailfin in control and during regeneration were separated by FACS. C Quantification of GFP+ cells as shown in FACS plots. Two-tailed t-test. D Western blotting (WB) of total S-nitrosylated proteins in zebrafish tailfin endothelial (GFP+) cells. E WB of Kdm1a and S-nitrosylated Kdm1a in endothelial (GFP+) cells control, injury and injury + PTIO (NO scavenger) 10 mM. Dot plot shows semi-quantitative analysis. p values vs. 5 dpa group. F Vessel density analysis in Tg(fli1:EGFP)y1 zebrafish tailfin uninjured, injured and injured + PTIO 10 mM, measured as total length of vessels. G ChIP-PCR analysis in GFP+ cells isolated from the regenerating tailfin showing H3K4me2-binding complex with vegfaa and tek promoters. Rabbit IgG were used as a negative control. H Real time PCR analysis for endothelial genes in GFP+ cells from zebrafish control, injury and injury + PTIO 10 mM. Histone H3 was used as loading control. One-way ANOVA followed by Bonferroni’s multiple comparisons test, p values indicate comparisons vs. uninjured. N = 3 biological replicates. Data are presented as mean values +/− SEM. |
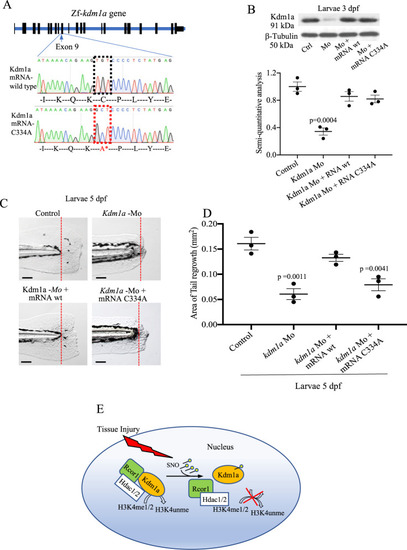
Modulation of Kdm1a S-nitrosylation during tailfin regeneration.
A Kdm1a mRNA C334A was generated by site-directed mutagenesis, replacing the aa Cys334 with Ala. B–D Zebrafish embryos injected with kdm1a morpholino (Mo), or co-injected with kdm1a Mo with kdm1a mRNA C334A or wild type. B Western blotting and semi-quantitative analysis showed the effective knockdown and rescue of kdm1a following the different treatments. β-tubulin was used as loading control. C, D Images and dot plot of tailfin regeneration following kdm1a modulation (p values vs. control). Scale bar measures 100 μm. E Working model. Tissue injury promotes the S-nitrosylation of the Cys334 of Kdm1a. S-nitrosylated Kdm1a detaches from the CoRest complex and loses its demethylase activity on H3K4. One-way ANOVA followed by Bonferroni’s multiple comparisons test, p values indicate comparisons vs. control. N = 3 biological replicates. Data are presented as mean values +/− SEM. |