FIGURE SUMMARY
Title

Surface-Displayed Amuc_1100 From Akkermansia muciniphila on Lactococcus lactis ZHY1 Improves Hepatic Steatosis and Intestinal Health in High-Fat-Fed Zebrafish

Authors
Zhang, F.L., Yang, Y.L., Zhang, Z., Yao, Y.Y., Xia, R., Gao, C.C., Du, D.D., Hu, J., Ran, C., Liu, Z., Zhou, Z.G.
Source
Full text @ Front Nutr

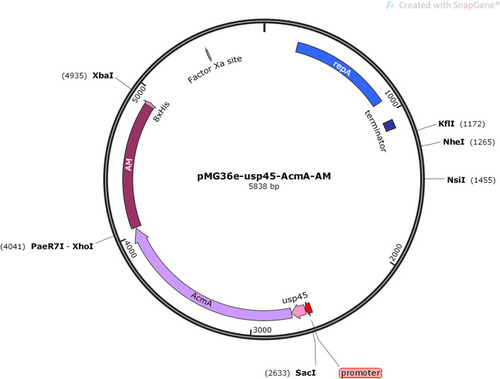
Schematic view of building the pMG36e-usp45-AcmA-AM plasmid.

Western blotting detects the expression of Amuc_1100 (AM) on ZHY1. Line 1: protein marker (26630, Thermo Scientific), line 2: the whole cell wall protein of recombinant strain AM-ZHY1, line 3: the whole cell wall protein of control strain ZHY1.

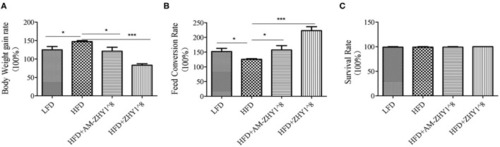
Effects of different diets on the (A) body weight gain, (B) feed conversion rate, and (C) survival rate of zebrafish. Data represent as the means ± SEM. The asterisks on the horizontal line represent significant differences between the two groups. *p < 0.05, ***p < 0.001.

Triacylglycerol (TAG) content of the livers of zebrafish in different groups. (A) TAG content of the liver, the significance level was determined by a Student's t-test (*p < 0.05). (B) Histological changes of liver sections measured by HE staining (scale bar is 50 μm).

Relative mRNA expression of lipid metabolic-related genes PPARγ (A), SREBP-1c (B), FAS (C), ACC1 (D), ATGL (E), UCP2 (F), CD36 (G), FABP6 (H) of the livers of zebrafish in different groups. Data are presented as mean ± SEM (n = 6). The asterisks on the horizontal line represent significant differences between the two groups. *p < 0.05, **p < 0.01.

Serum alanine aspartate aminotransferase [AST, (A)] and alanine aminotransferase [ALT, (B)] levels of zebrafish fed with a basal diet and high-fat diet, with AM-ZHY1(108cfu/g) and ZHY1(108cfu/g) supplemented with the high-fat diet. Data are presented as mean ± SEM (n = 6). The asterisks on the horizontal line represent significant differences between the two groups. *p < 0.05.

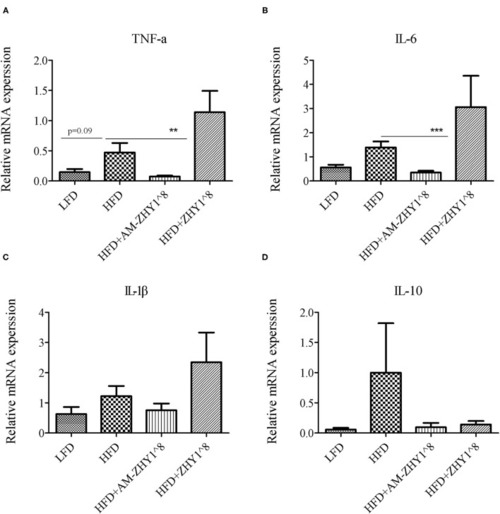
Relative mRNA expression of inflammation related genes: TNFα (A), IL-6 (B), IL-1β (C), IL-10 (D) of liver of zebrafish of different groups. Data are presented as mean ± SEM (n = 6). The asterisks on the horizontal line represent significant differences between the two groups. **p < 0.01, ***p < 0.001.

The effect of different diets on the relative abundance of intestinal flora at the phylum in zebrafish (A) and the genus (B) level. LFD, basal diet; HFD, high-fat diet; HFD_AM_ZHY1, supplement 108cfu/g AM-ZHY1 based on a high-fat diet; HFD_ZHY1, supplement 108cfu/g ZHY1 based on a high-fat diet.

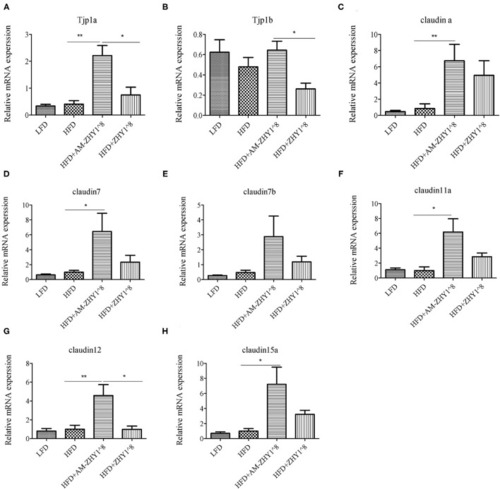
Relative mRNA expression of the tight junction protein genes TJP1a (A), TJP1b (B), Claudina (C), Claudin7 (D), Claudin7b (E), Claudin11a (F), Claudin12 (G), Claudin15a (H) of the intestines of zebrafish in different groups. Data are presented as mean ± SEM (n = 6). The asterisks on the horizontal line represent significant differences between the two groups. (*p < 0.05,**p < 0.01).

Acknowledgments
This image is the copyrighted work of the attributed author or publisher, and ZFIN has permission only to display this image to its users. Additional permissions should be obtained from the applicable author or publisher of the image. Full text @ Front Nutr