
- Title
-
Tpr Deficiency Disrupts Erythroid Maturation With Impaired Chromatin Condensation in Zebrafish Embryogenesis
- Authors
- Wu, S., Chen, K., Xu, T., Ma, K., Gao, L., Fu, C., Zhang, W., Jing, C., Ren, C., Deng, M., Chen, Y., Zhou, Y., Pan, W., Jia, X.
- Source
- Full text @ Front Cell Dev Biol

Erythroid maturation is disrupted in zebrafish mutantcas7. (A,B) Light microscope images of zebrafish wild-type (WT) sibling and mutantcas7 embryos at 3 dpf. (C–H) WISH analysis of ae1-globin (C,D), alas2 (E,F), and band3 (G,H) expression in sibling and mutantcas7 embryos at 3 dpf. After WISH and photographing, all embryos were extracted for genomic DNA and genotyped by sequencing, then the mutant percentage was evaluated. The number of embryos in a het-het incross clutch with the expression pattern is shown in the mutantcas7 column and corresponding percentages are listed inside each panel. Arrow in panel (E,F) indicates the alas2 staining in heart region. (I,J) Giemsa staining for erythrocytes at 4 dpf in sibling and mutantcas7. Relative to the number of orthochromatophilic erythroblasts, mutantcas7 displayed a marked increase in circulating polychromatophilic erythroblasts compared with sibling. Scale bars represent 10 μm. (K) Statistical analysis of the nucleus-to-cytoplasm (N/C) ratio in sibling and mutantcas7. N = 100, error bars represent SEM. ****p ≤ 0.0001. (L) The relative expression of αe1-globin, alas2, band3 in sibling and mutantcas7 embryos at 3 dpf. Error bars represent SEM. *p ≤ 0.05; **p ≤ 0.01; *** p ≤ 0.001. |

Positional cloning of mutantcas7. (A) Genetic mapping of the cas7 region on chromosome 20. Bulk segregation analysis positioned cas7 mutation to Chr. 20. Fine mapping using SSLPs narrowed down the region between markers SNP1 and SNP4, including tprb and two other genes as indicated. (B) There is a C-to-G missense mutation in tprb gene in mutantcas7, which leads to leucine to valine (L9V) at ninth amino acid in Tpr protein. (C) The ninth amino acid leucine of Tpr is highly conserved from human to fruit fly (* marked). (D) Comparison of the gene syntenic relationship between zebrafish tprb and human TPR loci. Seven genes, including TPR, are located within a genomic region on human chromosome 1. (Right) Seven zebrafish homologs of these genes are listed according to their map positions on chromosome 20 (Ensembl website). Mb, mega base. (E) Western blotting images of Tpr protein in whole embryo lysates of sibling and mutantcas7 embryos at the indicated time. All embryos were extracted for genomic DNA and genotyped by sequencing. |

Mutation in tprb gene is responsible for mutantcas7 phenotypes. (A–I) Morpholino knocking down of tprb mutantcas7 phenocopies. WISH results of ae1-globin (A,B), alas2 (C,D), and band3 (E,F) expression in control and tprb morphants at 3 dpf. The percentages of indicated phenotype are listed at the bottom of each panel. Arrow in panel (E,F) indicates the alas2 staining in heart region. (G,H) Giemsa staining for erythrocytes at 4 dpf in control and tprb morphants. More immature erythrocytes in tprb morphants are shown. Scale bars represent 10 μm. (I) Statistical analysis of the nucleus-to-cytoplasm (N/C) ratio in control and tprb morphants. N = 100, error bars represent SEM. ****p < 0.0001. (J) Construction of the plasmid used in Tol2-transposease-mediated rescue assay. (K–M) WISH analysis of ae1-globin expression in sibling, tprbcas7 mutants, and rescued embryos at 3.5 dpf. After WISH and photographing, all embryos were extracted for genomic DNA and genotyped by sequencing, then the rescue percentage was evaluated. The percentage of fully rescued mutant embryos is about 77% (10 out of 13 mutant embryos), while the rest are rescued partially. (N,O) Generation of tprb– 3+1 mutant via CRISPR-Cas9 technique. The alignment of WT and mutated sequences is listed. The underlined sequence is gRNA target site. The sequencing result of tprb genomic DNA shows a 3-bp deletion and 1-bp addition at exon 7 (N), which caused a premature stop codon leading to the production of a truncated 246-amino-acid Tpr protein (O). (P,Q) WISH results of ae1-globin expression in sibling and tprb– 3+1 mutant at 3 dpf. After WISH and photographing, all embryos were extracted for genomic DNA and genotyped by sequencing, then the mutant percentage was evaluated. The number of embryos in tprb– 3+1 mutant incross clutch with the expression pattern as shown in the tprb– 3+1 column and corresponding percentages are listed inside each panel. |

HIF signaling is not activated in tprbcas7 mutant. (A) The statistic results of the ratio of gata1+ cells sorted by flow cytometer in the whole embryo of control and tprb morphants by Tg(gata1: DsRed; kdrl: EGFP) transgenic line at different time points. (B) Quantitative PCR results of epo and vegfaa in control and tprb morphants at different time points. (C–F) WISH analysis of ae1-globin expression in sibling and tprbcas7 mutants at 3 dpf under the control and hif-2a morpholino (E,F) injection. (G) Immunoblotting analysis of TPR and HIF-1a protein level in whole HEK293T cells under normoxia and hypoxia conditions during TPR knockdown through siRNA. (H) Immunoblotting analysis of HIF-1a protein level in the nuclei of HEK293T cells under hypoxia condition after nuclear and cytoplasmic separation. C, cytoplasma; N, nucleus. (I) Quantitative PCR results of HIF target genes including TPR, PDK1, PGK1, and VEGF in HEK293T cells during TPR knockdown through siRNA. (J) Quantitative PCR results of HIF target genes including EPO and VEGF in Hep3B cells during TPR or VHL knockdown through siRNA under hypoxia condition. NC: negative control. #1: TPR siRNA 1; #1 + 2: TPR siRNA 1 + 2. Error bars represent SEM. N.S.: not significant; **p ≤ 0.01; ***p ≤ 0.001; ****p ≤ 0.0001. |

tprb inactivation enhances the transcriptional activity of erythroid genes. (A) Quantitative PCR results of ae1-globin, be1-globin, and alas2 in erythrocytes after sorting an equal number of gata1+ cells in control and tprb morphants at 3 dpf. (B) Quantitative qChIP results of the binding enrichment of RNA polymerase II (Pol II) in ae1-globin, be1-globin, and alas2 after sorting equal number of gata1+ cells. (C) Fluorescence in situ hybridization (FISH) results of ae1-globin mRNA localization in sibling and tprbcas7 mutants at 3 dpf. The nuclei were stained with DAPI (blue). Error bars represent SEM. N.S., not significant; *p < 0.05; **p < 0.01; ****p < 0.0001. Scale bars represent 20 μm. |
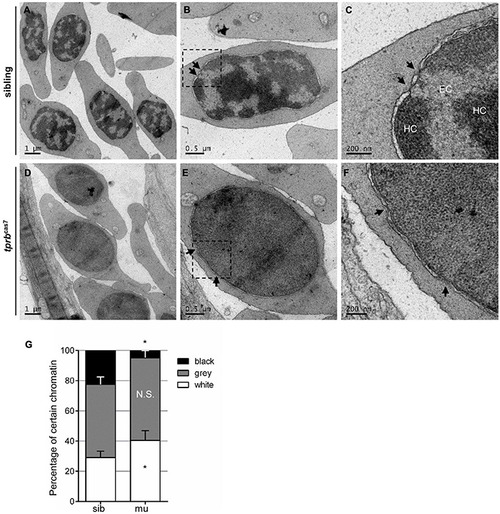
Chromatin condensation is defective in tprbcas7 mutant erythroid cells. (A–F) Representative transmission electron microscopy (TEM) images of erythrocytes from sibling (A–C) and tprbcas7 mutants (D–F) at 4 dpf. The images in panels (C,F) showed a higher magnification of the corresponding boxes (B,E). Arrows indicate nuclear pores. EC, euchromatin; HC, heterochromatin. Scale bars are shown in each image. (G) Quantifications of certain chromatin with classified different color in sibling and tprbcas7 mutants at 4 dpf. Error bars represent SEM. N.S., not significant; *p < 0.05. |