
- Title
-
Vitamin D deficiency promotes accumulation of bioactive lipids and increased endocannabinoid tone in zebrafish
- Authors
- Knuth, M.M., Stutts, W.L., Ritter, M.M., Garrard, K.P., Kullman, S.W.
- Source
- Full text @ J. Lipid Res.

Comparison of ROI lipid profiles from a VDD and VDS zebrafish. Mirror plots from full-scan MS1 spectra illustrate the chemical diversity and changes in lipid composition observed in VDD fish. |
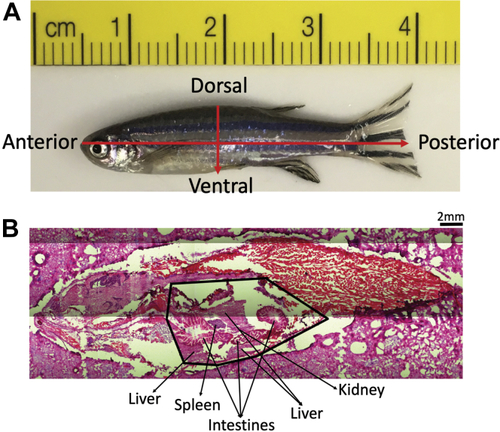
Zebrafish orientation. A: All fish shown in IR-MALDESI-MSI images are presented in anterior to posterior and dorsal to ventral orientation. B: Representative histology image of a VDD fish with the visceral cavity (liver, intestines, spleen, and kidney) labeled. |

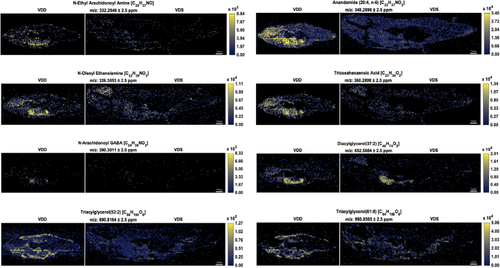
MSiReader images representing a select group of EC precursors detected in negative ionization mode. Fish are in anterior to posterior, dorsal to ventral orientation. Each image contains two male zebrafish at 6 mpf: a VDD fish (left) followed by a VDS fish (right). All ions were significantly (∗ |
MSiReader images representing a select group of EC ions detected in positive ionization mode. Fish are in anterior to posterior and dorsal to ventral orientation. Each image contains two male zebrafish at 6 mpf: a VDD fish (left) followed by a VDS fish (right). All ions were significantly (∗ |
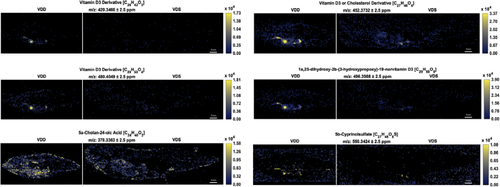
MSiReader images representing a select group of sterols in positive ionization mode. Fish are in anterior to posterior and dorsal to ventral orientation. Each image contains two male zebrafish at 6 mpf: a VDD fish (left) followed by a VDS fish (right). All ions were significantly (∗ |
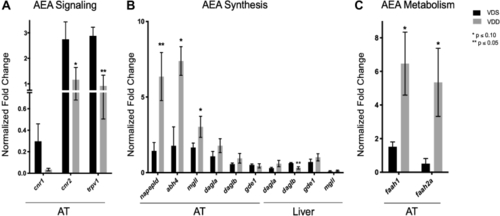
Evaluating AEA signaling, synthesis, and metabolism in VDD AT and Liver. A: VDD fish had significantly attenuated trpv1 and cnr2 expression and attenuated expression of cnr1 in AT compared with VDS fish. B: VDD fish had significantly increased napepld, abh4, and mgll expression in AT compared with VDS fish but significantly decreased daglb expression in liver. C: VDD fish had significantly increased faah1 and faah2a expression in AT compared with VDS fish. |