
- Title
-
Heading towards a dead end: The role of DND1 in germ line differentiation of human iPSCs
- Authors
- Mall, E.M., Lecanda, A., Drexler, H.C.A., Raz, E., Schöler, H.R., Schlatt, S.
- Source
- Full text @ PLoS One

(A) End-point PCR showing presence of large deletions in DND1 genomic locus. (B) All lines exhibited similar doubling times of about 20 hours. Doubling times counted from 4 independent passages per line. (C) About 90% of TS hiPSCs were double positive for OCT4 and NANOG, irrespective of DND1 status. CB hiPSCs showed reduced NANOG expression with 52–81% double positive cells. (D) RT-qPCR showed similar expression of OCT4, SOX2, and DNMTB1 in all lines compared to H9 hESCs. CB hiPSCs showed about 50% reduction of NANOG expression, irrespective of DND1 status. DND1 is expressed in low levels in hESCs and DND1+/+ hiPSCs and mRNA levels are strongly reduced in DND1-/- hiPSCs. The data were normalised to two internal controls (ACTB and GAPDH) and are shown as fold change to H9 ESCs. N = 3 biological replicates. |
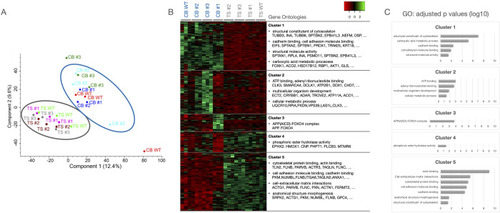
(A) Principal component analysis shows that the TS and CB lines cluster together, respectively, irrespective of their DND1 status. (B) Analysis of the differentially expressed proteins revealed 5 clusters. Highly represented gene ontology clusters and exemplary proteins are depicted. (C) Bar graphs showing the adjusted p values for the mentioned GO terms per cluster (log10 scale). |
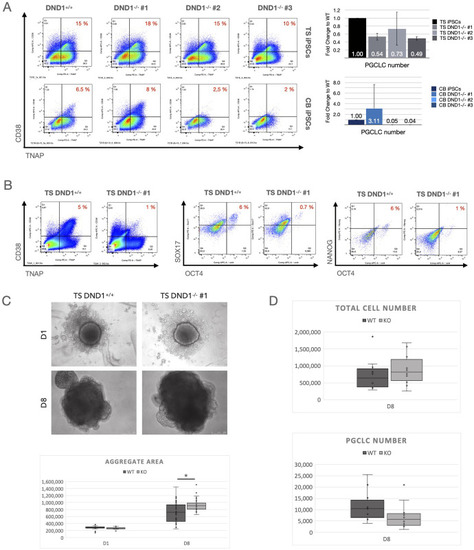
(A) All lines were differentiated using the spin EB method and sorted at D8 for CD38/TNAP double positive PGCLCs. Left: Flow cytometry results shown as dot plots, right: bar graphs with total PGCLC numbers derived. TS DND1-/- hiPSCs resulted in similar ratios but reduced total numbers compared to DND1+/+. CB hiPSCs differentiated less efficiently, and CB DND1-/- #2 & #3 died during PGCLC induction, resulting in low total cell numbers and very few PGCLCs. CB DND1-/- #1 showed efficient differentiation resulting in increased numbers of PGCLCs compared to CB DND1+/+ (n = 3). (B) We verified the results with TS DND1+/+ and TS DND1-/- #1 after aggregation in 96 well plates using staining against CD38/TNAP, OCT4/SOX17 and OCT4/NANOG. All three marker combinations resulted in reduced ratios and absolute numbers of PGCLCs in TS DND1-/- #1 compared to wildtype iPSCs. (C) We measured aggregate sizes (visible area) in D1 and D8 aggregates and found that DND1-/- #1 iPSCs aggregates were bigger compared to the control (n = 3 experiments, with 10 aggregates measured per cell line and experiment). Difference on D8 is significant with * p< 0.01 tested with pairwise t-tests. (D) When we analysed the total cell numbers derived per experiment, TS DND1-/- #1 showed higher total cell numbers while PGCLCs were reduced (n = 10 experiments). Differences in total and PGCLC number did not reach statistical significance between WT and KO cells (pairwise t-test with p<0.05). |
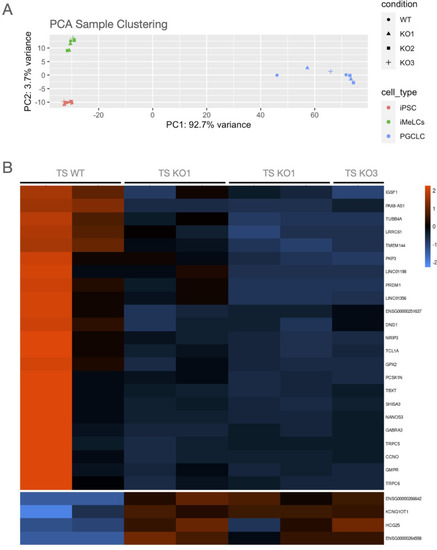
(A) PCA clustering showed that DND1 KO lines clustered together with DND1 WT lines. Main differences are associated with the differentiation status, with PGCLCs clustering distinct from iPSCs and iMeLCs. (B) Heatmap showing differentially expressed genes in PGCLCs. DND1 KO PGCLCs show decreased expression in known PGC differentiation regulators as PRDM1 and NANOS3 (cluster 1). |