
- Title
-
Role of BMP signaling during early development of the annelid Capitella teleta
- Authors
- Webster, N.B., Corbet, M., Sur, A., Meyer, N.P.
- Source
- Full text @ Dev. Biol.
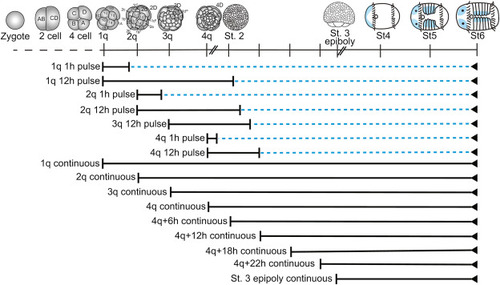
Fig. 1. List of exogenous BMP4 treatments performed. Solid black line: Animals raised in ASW + PS + BMP4 protein. Blue dashed line: Animals raised in ASW + PS. Blue tissue in stages 4–6 larvae: neural tissue. |
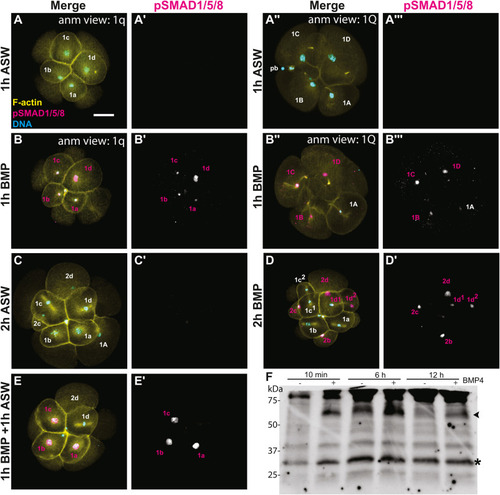
Fig. 2. Increase in pSMAD1/5/8 after BMP exposure. (A–E) z-stacked images of immunostaining, A) 1 h ASW treatment (8 cell embryo). B) 1 h BMP treatment (8 cell embryo). C) 2 h ASW treatment (10 cell embryo). D) 2 h BMP treatment (13 cell). E) 1 h BMP followed by 1 h ASW treatment (9 cell embryo). (A–D) merged micromeres; (A′-D′) pSMAD1/5/8 from (A–D); (A″-D″) merged macromeres, (A‴-D‴) pSMAD1/5/8 from (A″-D″). yellow: F-actin; magenta: pSMAD1/5/8; cyan: DNA. F) western blot of pSMAD1/5/8 on 2q animals with either mock (−) or BMP (+) for 10min, 6 h, or 12 h (n = 80 per lane). ∗, presumed pSMAD1/5/8; arrowhead, unknown band, see text. |

Fig. 3. SMAD Alignments of C. teleta A) SMAD1/5/8 showing the loss of the conserved start codon (~18aa); the next start codon is at 225 aa. B) SMAD2/3 and SMAD1/5/8 alignments showing the conserved C-terminus where the pSMAD1/5/8 antibody 41D10 binds. Species are as follows: Ct-Capitella teleta, Hro – Helobdella robusta, Crg – Crassostrea gigas, Hu – human, and the spider Stm - Stegodyphus mimosarum. Protein domains: MH1, MAD homology 1; MH2, MAD homology 2; NES, nuclear export signal; NES2, nuclear export signal 2; NLS, nuclear localization signal. |
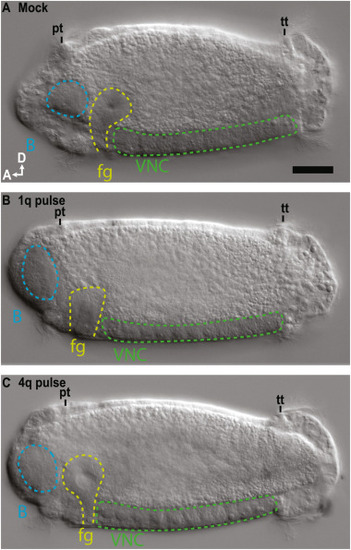
Fig. 4. Left lateral z-stacked DIC images showing D-V axis formation in A) mock, B) 1q pulse, and C) 4q pulse animals. brain, B (blue); foregut, fg (yellow); prototroch, pt; telotroch, tt; ventral nerve cord, VNC (green), A, anterior; D, dorsal, scale bar = 50 μm. |

Fig. 5. Ct-chrdl expression. (A–B) Dorsal z-stack of Ct-chrdl mRNA expression in (A) Mock and (B) 3q cont BMP-treated animals. C) Boxplot showing the significant effect of BMP treatment on the width of Ct-chrdl expression, letters indicate significance groups. A, anterior; R, right side; scale bar = 50 μm. |

Fig. 6. Ct-elav1 expression in BMP-treated animals. (A–A‴) Mock (n = 37), dashed lines in (A'') represent focal depths of (A) and (A'). (B–B‴) 1q pulse (n = 36). (C–C‴) 4q pulse (n = 36). (D–D‴) 1q cont (n = 45) showing collapse of some hemiganglia expressing Ct-elav1. Scale bar = 50 μm; br: brain, VNC: ventral nerve cord, A, anterior; D, dorsal, L. left. |

Fig. 7. Ventral z-stack of the serotonergic (5HT, white), and anti-acetylated tubulin staining (red) in the VNC with a nuclear stain (blue). Only minor disorganization was seen in 1q pulse (B), 4q pulse (C), or st 3 cont (D) animals compared to mock (A). A, anterior; L, left side; scale bar = 50 μm. |

Fig. 8. Trunk neural phenotype in cont BMP-treated (Z-stack). (A,D) A mock animals showing wild-type phenotype. (B,E) 4q+22 h continuous animals showing a severe VNC collapse phenotype. (C,F) 4q+22 h continuous animals showing a mild VNC collapse. (A–C) acetylated-tubulin showing neurotroch cilia, (A′-C′) acetylated-tubulin in the VNC. (D–F) Hoechst nuclear stain. (D′-F′) 5HT (D″-F″) Pax, arrowhead: normally bilaterally-symmetric cells on either side of the midline in each segment. Figure panels with the same letter represent the same animal. A, anterior, L, left side, nt, neurotroch; pt, prototroch; tt, telotroch; VNC, ventral nerve cord; scale bar = 50 μm (G) Boxplot showing the significant effect of treatment on proportion of segments with collapsed hemiganglia, letters indicate significance groups. |

Fig. 9. Larval eye pigment cells after BMP treatment. A–D Most common eye pigment cell (orange) phenotypes, anterior view. A) 0 eyes (1q pulse), B) 2 wild-type eyes (1q pulse), C) 3 eyes centered (1q pulse), D) 3 eyes stacked (1q pulse). R, right side; D, dorsal. E. Proportion of animals with each eye phenotype in each BMP treatment (colors correspond to boxes in A–D, and yellow: other (see text for a description of other eye phenotypes). Letters indicate significance groups. |

Fig. 10. The effect of BMP treatment on larval and juvenile eye sensory cells (SCs). A–E) Larval eye SC phenotypes after BMP treatment. F–J) BMP increased the number of juvenile eye SCs. A) Proportion of animals with each larval eye SC phenotype in each BMP treatment. Letters indicate significance groups; colors are the same as in Fig. 9. B–E) Anterior z-stack of stage 6 larvae showing (B–D) larval SCs (22C10, yellow, arrows), nuclei (ToPRO3-iodide, teal), and muscles and microvilli (phallacidin, magenta). E) Image of single larval eye SC. F) Proportion of animals with each number of juvenile eye SCs in each BMP treatment. G–J) Juvenile eye SCs (22C10, arrowheads). B,G) Mock, C,H) 1q pulse, and E,I) 4q pulse animals. R, right side, D, dorsal, scale bars = 50 μm. |

Fig. 11. Localization of 5HT+ soma in the episphere. A–D) ASW (A) and mock (B–D) treatment animals had a symmetric bimodal distribution of 5HT+ cells, indicative of a left and right brain lobe. E–I) 1q (E), 2q (F–H), and 3q (I) pulse BMP treatment animals showed a uniform distribution of 5HT+ cells, indicative of a radialized brain. J–L) 4q pulse animals showed a bimodal ventral distribution of 5HT+ cells, indicative of a ventralization of the brain. A,B, E,F, I,J) Percentage of animals with 5HT+ cells in each region of the episphere. C,G,K) Immunolabeling of 5HT in 3 treatments representative of the 3 brain states. D,H,I) Merged images showing immunolabeling for 5HT (magenta) and acetylated tubulin (white) and staining for nuclei (Hoechst, cyan). White arrows: Mean vectors(s) of 5HT localization model, scale bars: 50 μm. |
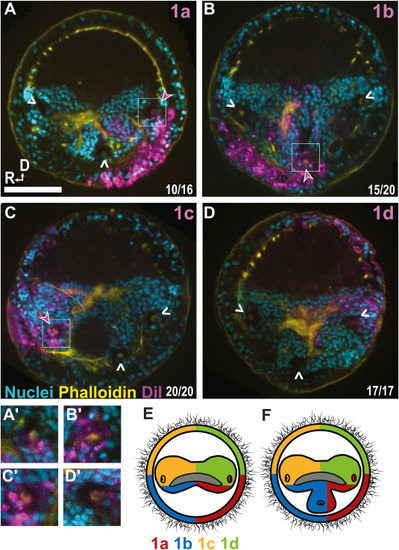
Fig. 12. DiI localization and fate map of the eyes and brain of animals treated with BMP with a 4q pulse (Z-stack). A) 1a injected, showing contributions to the left brain lobe and eye B) 1b injected, showing contributions to the right brain lobe and the ectopic eye and brain lobe C) 1c injected, showing contributions to the right brain lobe. D) 1d injected, showing contributions to the left brain lobe. A′-C′) Inset of eye with DiI labeling (D′) Inset of eye without DiI labeling. E) Contribution of 1q micromeres to the episphere in wildtype animals. F) Predicted contribution 1q micromeres including the contribution of 1b to the third ectopic eye in BMP-treated 3-eyed animals. Arrowheads, eye location; pink closed arrowhead; eye with DiI; white open arrowhead, eye without DiI; cyan, nuclei; yellow, phalloidin; magenta, DiI; scale bar = 50 μm. |

Fig. 13. The effect of BMP treatment on foregut morphology. A) Bilobed foreguts in mock and ASW control animals. B) 1q, 2q, and 3q 12 h pulse animals had small round foreguts (100%). C) Foreguts of 4q 12 h pulse animals were trilobed (100%). (D–E) Total foregut area was significantly smaller in animals subjected to 1q, 2q, 3q, and 4q 12 h BMP pulse than the controls. Animals in E were fixed at a later stage than animals in D and could not be compared due to significant size difference in mock animals. brain, br; foregut, yellow dashed line; scale bar: 50 μm. |

Fig. 14. Overview of BMP treatment results and hypothesized fate switching time windows in C. teleta. Top: Eyes, brain, and foregut resulting phenotypes and inferred BMP signaling window. Purple: no eyes, radialized brain, small foregut. Pink: 3 eyes, 3 brain lobes, 3 foregut lobes. Bottom: Ventral midline inferred BMP signaling window and resulting phenotypes. Blue: loss of ventral midline. Black line: wild type. Lighter colors indicate less penetrant phenotype. |

Fig. 15. BMP ligand and inhibitor cleavage ISH patterns from Webster et al., in prep. A-C) Ct-bmp2/4 (blue) and Ct-nogA (orange) at 1q (A), 2q (B), and 3q (C). D-F) Ct-bmp5-8 (blue) and Ct-chrdl (orange) at 1q (D), 2q (E), and 3q (F). |
Reprinted from Developmental Biology, 478, Webster, N.B., Corbet, M., Sur, A., Meyer, N.P., Role of BMP signaling during early development of the annelid Capitella teleta, 183-204, Copyright (2021) with permission from Elsevier. Full text @ Dev. Biol.