
- Title
-
In situ and transcriptomic identification of microglia in synapse-rich regions of the developing zebrafish brain
- Authors
- Silva, N.J., Dorman, L.C., Vainchtein, I.D., Horneck, N.C., Molofsky, A.V.
- Source
- Full text @ Nat. Commun.
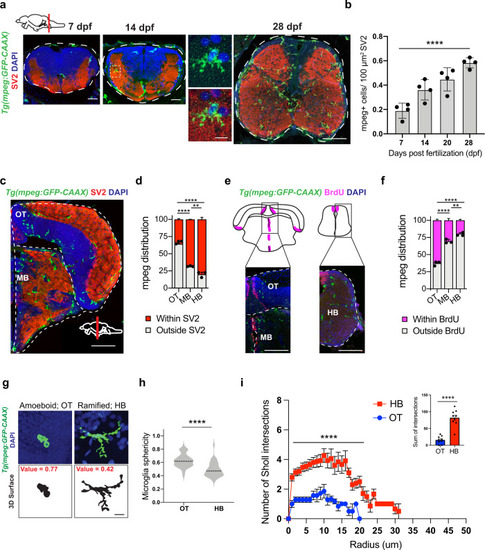
a Representative images of microglia (mpeg1.1-GFP+) and synapses (SV2 antibody stain) in developing zebrafish hindbrain. Inset: representative synapse-embedded microglia at 14 dpf. Scales: 7–14 dpf, 20 µm; 28 dpf, 50 µm; inset, 5 µm. All images are representative of the n = 4 replicates. b Quantification of mpeg1.1-GFP+ cells per 100 μm2 of SV2+ synaptic area at 7, 14, and 28 days post fertilization. Dots represent four individual fish, data are mean ± SD. One-way ANOVA *p < 0.0001. c–d Representative images and quantification of the proportion of mpeg1.1-GFP+ cells in synaptic (SV2+; red) vs. cellular (DAPI+/SV2−; gray) areas. Distribution quantified within each brain region as outlined (dotted lines): midbrain (MB), optic tectum (OT), and hindbrain (HB, see panel 1 A). Mean ±SEM from n = 3 fish. Two-way ANOVA with Tukey’s post hoc comparison; ****p < 0.0001, **p < 0.0029. Scale: 50 µm. e–f Representative images and quantification of the proportion of mpeg1.1-GFP+ cells within 20 µm of BrdU+ neurogenic regions (purple) vs. outside neurogenic regions (gray). Mean ±SEM from n = 3 fish. Two-way ANOVA with Tukey’s post hoc comparison; ****p < 0.0001, **p < 0.0062. Scale: 50 µm. g Representative images of mpeg1.1-GFP+ microglia and thresholded maximal projections in OT and HB at 28 dpf. Value = sphericity; scale 0–1, 1 = most spherical/ameboid. 5 µm. Images are representative of respective values indicated in red. h Quantification of microglial sphericity from images thresholded as in g. n = 50 microglia per region from n = 4 fish. The dotted line indicates the median. two-tailed unpaired t test; ****p < 0.0001 I Sholl analysis quantifying the number of intersections (y axis) measured at 1 µm increments from the soma (x axis) in microglia from optic tectum (OT) and hindbrain (HB). Total of n = 9 microglia per region from n = 3 fish. Mean ±SEM. Two-way ANOVA with Sidak’s multiple comparisons; ****p < 0.0001. Inset: two-tailed unpaired t test; ****p < 0.0001. See also Fig. S1. |
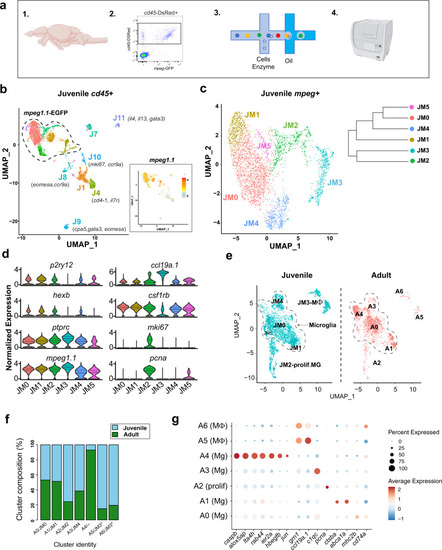
a Schematic diagram of the whole-brain scRNA-sequencing pipeline (items 1 and 4 adapted from BioRender.com (2020). Retrieved from https://app.biorender.com/biorender-templates. b Unsupervised clustering of 6666 juvenile ptprc (cd45)+ cells, colored by cluster. Inset: feature plot of mpeg1.1 expression. n = 10 fish in two independent replicates. Color-coding for inset: normalized mpeg1.1 expression; low expression, gray; high expression, orange. c Subclustering of 3539 mpeg1.1+ cells in c, colored by cluster. Inset: cluster dendrogram. d Violin plots for select marker genes across juvenile clusters from c (JM1-5), including microglia (p2ry12, hexb, and csf1rb), pan-myeloid (mpeg1.1), pan-hematopoietic (ptprc/cd45), macrophage (ccl19a.1) and proliferative (mki67 and pcna). Colors correspond with clusters shown in Fig. 2c. (Solid black line = median; dotted lines = 1st and 3rd quartiles; any lines not visible fall at 0). e UMAP plots showing co-clustering analysis of juvenile cells in c (blue) and 2080 adult (red) myeloid (mpeg1.1+) cells. Data sets were merged then integrated with the Harmony R package before clustering. Conserved macrophage and proliferative clusters indicated. The dotted line outlines the remaining “homeostatic” microglial clusters. f Percent of each cluster shown in e consisting of Juvenile (blue) vs. Adult (green) derived cells. Normalized within groups to account for overall cell number difference between ages. Asterisks indicate a shared juvenile cluster. g Dot plot highlighting select up- and downregulated genes within the combined juvenile and adult clustering in e. Size represents the percent of cells expressing each gene while the color represents normalized and scaled gene expression compared with all clusters; decreased expression: blue, expression unchanged: white, increased expression: red (MAST DE algorithm in Seurat, p < 0.01). See also Fig. S2 and Fig. S3; Supplementary Data S1–S3. |

a Schematic of region-specific bulk-sequencing approach using Tg(mpeg1.1:EGFP). b Principal component analysis (PCA) plot of top 500 most variable genes for OT, MB, HB regions (dots = independent replicates from 10 pooled fish/replicate). c Heatmap of differentially expressed genes (DEGs) from mpeg1.1-EGFP positive cells across brain regions (adjusted p value < 0.05). Selected top differentially expressed genes from each cluster highlighted. Color-coding, decreased expression; blue, no expression; white, high expression; red. d–e Representative images and quantification of cd74a expression across brain regions by in situ hybridization (ISH), colocalized with mpeg1.1-GFP+. Quantification shows a percentage of cd74+ mpeg1.1-GFP+ microglia within each brain region. Dots represent three individual fish, data are mean ± SD. One-way ANOVA with Tukey’s post hoc test. **p < 0.0079, ****p < 0.0001, **p < 0.0021. Scale: 50 µm. All images are representative of the n = 3 replicates. f–g Representative images and quantification of ctsba expression by ISH colocalized with mpeg1.1-GFP. Quantification shows percentage ctsba+ mpeg1.1-GFP+ microglia within each brain region. Dots represent three individual fish, data are mean ± SD. One-way ANOVA with Tukey’s post hoc test. ***p < 0.0003, ****p < 0.0001. Scale: 50 µm. All images are representative of the n = 3 replicates. See also Fig. S4, Supplementary Data S4. |

|
|