
- Title
-
Analysis of the mast cell expressed carboxypeptidase A3 and its structural and evolutionary relationship to other vertebrate carboxypeptidases
- Authors
- Akula, S., Hellman, L., Avilés, F.X., Wernersson, S.
- Source
- Full text @ Dev. Comp. Immunol.
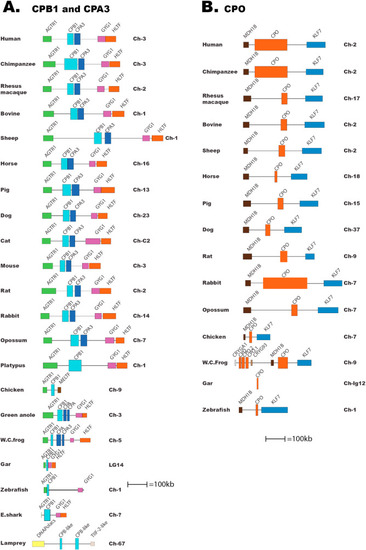
Fig. 1. The two loci for CPB1 and CPA3 and for CPO. The genes encoding carboxypeptidases are depicted in double-height to easily locate them in the maps. The bordering genes are included to trace the origin of the locus and to also define changes that have occurred upstream or downstream of the locus. Gene names for the carboxypeptidases, as given in the database. Panel A; shows the CPB1-CPA3 locus. The CPB1 genes are depicted in light blue and the CPA3 gene is a slightly darker blue. The bordering genes are shown in different colors to easily distinguish them from each other and from the CPs. Panel B shows the CPO locus. The CPO gene is depicted in Orange. |
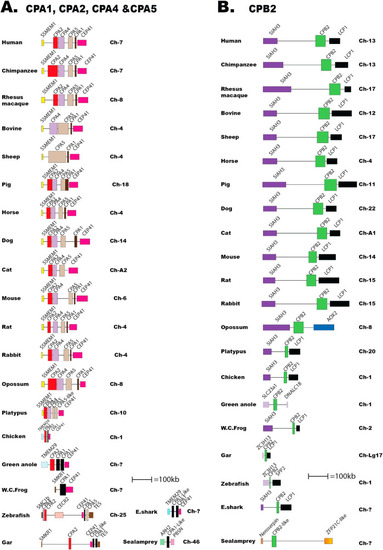
Fig. 2. The two loci for CPA1, CPA2, CPA4 and CPA5 and for CPB2. The genes encoding carboxypeptidases are depicted in double-height to easily locate them in the maps. The bordering genes are included to trace the origin of the locus and to also define changes that have occurred upstream or downstream of the locus. Gene names for the carboxypeptidases, as given in the database. Panel A shows the locus encoding the CPA cluster with the genes CPA1, CPA2, CPA4 and CPA5. The CPA2 genes are depicted in red, the CPA4 in purple, the CPA5 in beige and the CPA1 in black. The bordering genes are depicted in different colors to easily distinguish them from each other and from the CPs. Panel B; shows the CPB2 locus. The CPB2 gene is depicted in light green. |
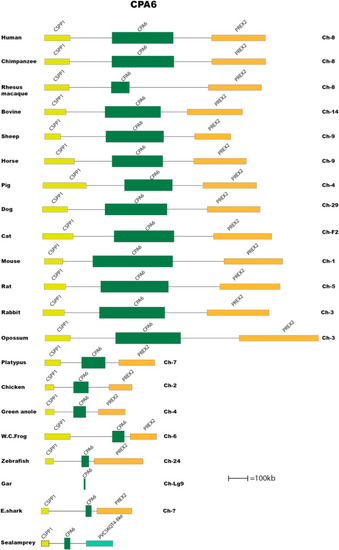
Fig. 3. The CPA6 gene locus. The genes encoding CPA6 are depicted in double-height to easily locate them in the maps. The bordering genes are included to trace the origin of the locus and to also define changes that have occurred upstream or downstream of the locus. Gene names for the carboxypeptidases, as given in the database. The CPA6 gene is depicted in dark green. The bordering genes deposited in different colors to easily distinguish. |

Fig. 4. Exon intron structure of human CPA3, CPO, CPB1 and CPA6. This figure is included to show the marked difference in size of these genes and that the size difference depends on difference in size of several of the introns and not on exon size differences. The exons are shown as vertical lines. |
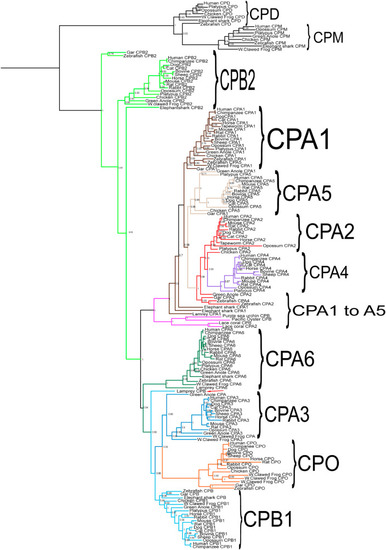
Fig. 5. A phylogenetic tree of the protein sequences of M14A carboxypeptidases CPA1, CPA2, CPA3, CPA4, CPA5, CPA6, CPO, CPD and CPM. The tree was constructed using MrBayes with the MCMC method and the sequences were obtained from NCBI tblastn by homology search. Phylogenetic tree of carboxypeptidase relationships based on Bayesian inference with the MrBayes program of CPs genes. Numbers on nodes indicate posterior probabilities. The branches representing the different CPs are depicted in the same colors as in the loci Fig. 1, Fig. 2, Fig. 3 and with CPA1 in brown, CPA2 in red, CPA3 in dark blue, CPA4 in purple, CPA5 in beige, CPA6 dark green, CPO in orange, CPB1 in light blue and CPB2 in light green. Noteworthy is the inclusion of the related M14B CPs, CPD and CPM in the analysis, belonging to the related M14B subfamily, appearing in black in the upper branch of the tree, as an outgroup to obtain a more robust tree. |