
- Title
-
Neuroblastoma differentiation in vivo excludes cranial tumors
- Authors
- Treffy, R.W., Rajan, S.G., Jiang, X., Nacke, L.M., Malkana, U.A., Naiche, L.A., Bergey, D.E., Santana, D., Rajagopalan, V., Kitajewski, J.K., O'Bryan, J.P., Saxena, A.
- Source
- Full text @ Dev. Cell
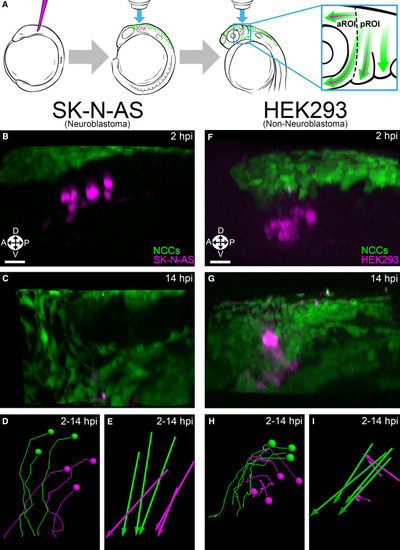
(A) Schematic representation of the procedure used to study NB in live zebrafish embryos. Dotted line divides the aROI and pROI, and arrows indicate NC (green) and NB (purple) migration. (B and C) 3D projections of Hoechst 34580-labeled (nuclear) injected SK-N-AS NB cells (purple; n = 8 embryos) alongside NCCs (green) at 2 hpi (premigratory) (B) and 14 hpi (C) in zebrafish embryos. (D and E) SK-N-AS cell tracks (D) and displacements (E) at 2–14 hpi. (F and G) 3D projections of Hoechst 34580-labeled HEK293 cells (n = 5 embryos) alongside NCCs at 2 hpi (F) and 14 hpi (G). HEK293 cell tracks (H) and displacements (I) at 2–14 hpi. Orientation: A: anterior; P, posterior; L, lateral; D, dorsal; V, ventral. Scale bar (B–I), 30 μm. |

(A and B) Lateral view schematics of zebrafish embryos injected with membrane-localized mCherry-expressing SK-N-AS NB cells (empty or scrambled vector; n = 30 embryos) at 2 hpi (A) and 14 hpi (B), for aROI and pROI assays only. Black letters/numbers indicate sites of injection; red and blue letters/numbers indicate final locations of neuronal and non-neuronal cells, respectively. (C–F) Still images from Video S7 of an injected SK-N-AS cell undergoing differentiation and apoptosis in the aROI. (G and H) Representative 3D projections of neuronal (G) or non-neuronal (H) SK-N-AS cells (purple) with length measurements. (I) Scatter plot of neuronal (red) and non-neuronal (blue) maximal projection lengths and their segregation into aROI, pROI, and trunk groups (gray). (J) The ratio of the number of SK-N-AS cells at 48 and 72 hpi in comparison with 15 hpi (n = 21 embryos for aROI and n = 9 embryos for pROI). (K–N′) 3D projections of injected NEUROD1:eGFP-expressing SK-N-AS cells present in the aROI or pROI at 3 hpi (K–L′) and 8 hpi (M–N′). (O) The percentage of SK-N-AS cells expressing NEUROD1:eGFP in vitro (cultured cells) or in vivo in the aROI or pROI. (P) Normalized eGFP intensity of single NEUROD1:eGFP-expressing cells in the aROI at 3–8 hpi (n = 10 cells, 1 representative cell/embryo). Horizontal bars (I, J, O, and P) denote mean values, with 95% confidence intervals indicated. n.s. p > 0.05; ∗p < 0.05; ∗∗p < 0.01; ∗∗∗p < 0.001. Scale bar: (A and B) 100 μm; (C–F) 40 μm; (G, H, and K–N′) 15 μm. |

(A) Lateral view schematic of a mouse E10.5 embryo indicating the locations of head and trunk xenotransplantation. (B–E′) 5 μm optical slices of whole-mount immunolabeling for anti-neurofilament (NF; white) of representative SK-N-AS NB (B–C′) or A375 melanoma (D–E′) cells at 14 hpi in E10.5 mouse embryos. Head injections targeted a region populated by cranial neural crest cells, analogous to that targeted in zebrafish. 71% of assayed embryos (n = 12/17 embryos) with SK-N-AS injections into the head harbored NF-positive cells, whereas 0% of assayed embryos (n = 0/11 embryos) with SK-N-AS injections into the trunk harbored NF-positive cells. No embryos with A375 melanoma injections into the head (n = 0/16 embryos) or trunk (n = 0/14 embryos) harbored NF-positive cells. Scale bar, 10 μm. |
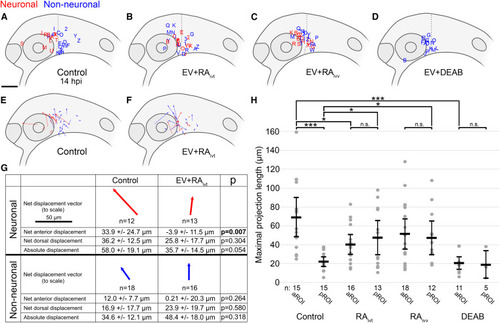
(A–D) Lateral view schematics of zebrafish embryos at 14 hpi that were injected with membrane-localized mCherry-expressing SK-N-AS NB cells that either differentiated into neurons (red) or not (blue) during time-lapse imaging. (A) Empty vector (EV) or scrambled vector (n = 30 embryos), duplicated from Figure 2B for clarity; (B) EV + 5 μM RA on cultured cells for 24 h pre-injection (n = 29 embryos); (C) EV + 1 μM RA on host embryos post-injection through time-lapse (n = 30 embryos); (D) EV + 50 μM DEAB on host embryos 2 h pre-injection through time-lapse (n = 16 embryos). (E and F) Displacement vectors for untreated SK-N-AS cells (n = 30 embryos) (E) and RA-treated SK-N-AS cells (n = 29 embryos) (F). Red and blue vectors are for neuronal and non-neuronal cells, respectively. (G) Aggregates of displacements for untreated and RA-treated SK-N-AS cells divided into neuronal and non-neuronal categories. Arrows are scaled, and their orientations correspond to orientations in (E) and (F). Net anterior and dorsal displacements, as well as absolute displacements across all axes, are shown along with p values. Displacements are affected by embryo growth such that dorsal values are skewed positively despite most cells migrating ventrally; therefore, comparisons are made only relative to appropriate controls. (H) Scatter plot of maximal projection lengths and their segregation into aROI and pROI groups stratified by tested conditions. Control aROI and pROI columns are duplicated from Figure 2I for clarity and are composed of scrambled and empty vector data points. Horizontal bars denote mean values, with 95% confidence intervals indicated. n.s. p > 0.05; ∗p < 0.05; ∗∗∗p < 0.001. ivt, in vitro; ivv, in vivo. Scale bar (A–F), 100 μm. Scale bar (G), 50 μm. |
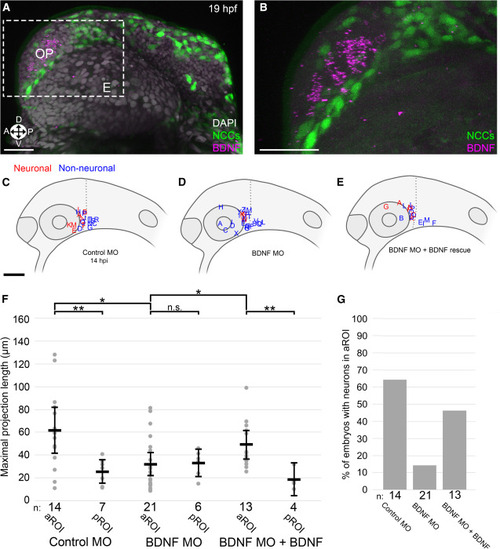
(A and B) Representative 3D projection of BDNF HCR (purple), NCCs (green), and DAPI nuclear labeling (gray) (A) with inset (B) (gray) in 19 hpf zebrafish embryos, corresponding developmentally to 5 hpi. E, eye; OP, olfactory placode; Orientation: A, anterior; P, posterior; D, dorsal; V, ventral. (C–E) Lateral view schematics of zebrafish embryos at 14 hpi that were injected with membrane-localized mCherry-expressing SK-N-AS NB cells after injection at the 1-cell stage with (C) 5 ng control morpholino (MO), (D) 2 ng BDNF translation-blocking MO, or (E) 2 ng BDNF translation-blocking MO + 200 ng/mL human BDNF starting at 4 hpf. Red and blue labels indicate final locations of neuronal and non-neuronal cells, respectively. (F) Scatter plot of maximal projection lengths segregated into aROI and pROI. Horizontal bars denote mean values, with 95% confidence intervals indicated. n.s. p > 0.05, ∗p < 0.05, ∗∗p < 0.01. (G) Percentage of embryos in which SK-N-AS cells differentiated into neurons in the aROI. Scale bar (A and B), 20 μm. Scale bar (C–E), 100 μm. |

(A–E) Lateral view schematics of zebrafish embryos at 14 hpi that were injected with membrane-localized mCherry-expressing SK-N-AS NB cells that either differentiated into neurons (red) or not (blue) during time-lapse imaging. (A) Empty vector (EV) or scrambled vector (n = 30 embryos), duplicated from Figure 2B for clarity; (B) ITSN1 short hairpin 1 (sh1) or short hairpin 2 (sh2) (n = 29 embryos combined) (C) EV + 100 μM LY294002, a reversible PI3K inhibitor, on cultured cells for 2 h pre-injection (n = 20 embryos). (D) EV + 100 nM wortmannin, an irreversible PI3K inhibitor, on cultured cells for 24 h pre-injection (n = 19 embryos). (E) EV + 1 μM wortmannin on cultured cells for 24 h pre-injection and 1 μM RA on host embryos post-injection through time-lapse (n = 23 embryos). (F–I) Cell numbers at 48 and 72 hpi normalized to 15 hpi and their segregation into pROI or aROI groups in tested conditions compared with control SK-N-AS cells: ITSN1-silenced (sh2) SK-N-AS cells (F and G), PI3K inhibitor (either LY294002 or wortmannin)-treated SK-N-AS cells (H and I). Control pROI and aROI values are duplicated from Figure 2J for clarity. (J) Scatter plot of maximal projection lengths and their segregation into aROI and pROI groups stratified by tested conditions. Control aROI and pROI columns are duplicated from Figure 2I for clarity and are composed of scrambled and empty vector data points. (K–L′) 9 μm thick optical slices of representative SK-N-AS cells expressing the GFP-AktPH construct in the aROI (K and K′) or pROI (L and L′). Dashed lines denote membrane projections and arrows indicate the base of projections. (M) Scatter plot of GFP intensity in a 2 μm diameter sphere adjacent to the cell membrane when the maximal projection first forms. (N) GFP intensity (2 μm diameter sphere) of single representative cells over time in the aROI (red; K and K′), pROI (blue; L and L’), aROI with ITSN1 sh2 (black), or aROI post-treatment with 1 μM wortmannin and 1 μM RA (gray). Horizontal bars denote mean values, with 95% confidence intervals indicated. n.s. p > 0.05; ∗p < 0.05; ∗∗p < 0.01; ∗∗∗p < 0.001. ivt, in vitro; ivv, in vivo. Scale bar (A–E), 100 μm. Scale bar (K and L′), 5 μm. |
Reprinted from Developmental Cell, 56(19), Treffy, R.W., Rajan, S.G., Jiang, X., Nacke, L.M., Malkana, U.A., Naiche, L.A., Bergey, D.E., Santana, D., Rajagopalan, V., Kitajewski, J.K., O'Bryan, J.P., Saxena, A., Neuroblastoma differentiation in vivo excludes cranial tumors, 2752-2764.e6, Copyright (2021) with permission from Elsevier. Full text @ Dev. Cell