Generation of shank3a and shank3ab mutants in zebrafish by CRISPR-Cas9 gene editing. (A) Structures of zebrafish shank3a and shank3b (Liu et al., 2018) gene and protein domains (ANK, ankyrin repeat domain; SH3, Src homology 3 domain; PDZ, PSD-95/discs large/ZO-1 domain; SAM, sterile alpha motif domain). Exon 9 is the target for CRISPR/Cas9 gene editing in zebrafish shank3a and exon 2 is the target for shank3b. The CRISPR/Cas9 induced frameshift mutations in shank3a (5-base deletion) and in shank3b (5-base deletion and 13-base insertion) which led to the truncation of the protein (Liu et al., 2018). (B) The mutations of shank3a and shank3b (Liu et al., 2018) were verified by Sanger sequencing. The predictions of protein spatial structures were both suggested that shank3a and shank3b proteins were likely to turn into truncated proteins (https://www.swissmodel.expasy.org/interactive/wUdwQQ/models/). (C) Reduced expression level of shank3a mRNA in the brain of shank3a– /– and shank3ab– /– adult (4 mpf) male zebrafish analyzed by RT-qPCR, while shank3b– /– was not affected. (D) Reduced expression level of shank3b mRNA in the brain of shank3b– /– and shank3ab– /– adult (4 mpf) male zebrafish analyzed by RT-qPCR, while shank3a– /– was not affected. Data are shown as mean ± SEM; **P < 0.01. ****P < 0.0001.

Morphological characteristics and locomotion activity alteration in shank3-deficient zebrafish. (A) Abnormal morphological changes in shank3a– /–, shank3b– /–, and shank3ab– /– larvae at ∼1 dpf, including death (WT, N = 340; shank3a– /–, N = 266; shank3b– /–, N = 270; shank3ab– /–, N = 118, severe developmental delay and tail bending (N = 60 each group). (B) Schematic diagram of the open field test and thigmotaxis test of adult male zebrafish (3.5 mpf). In the analysis of thigmotaxis test, the area of the peripheral zone is equal to the center zone (dotted line). (C) Compared with WT zebrafish (N = 12, 8.8 ± 2.4 cm/min), all shank3-deficient zebrafish displayed significantly decreased swimming velocity (shank3a– /–, N = 14, 6.1 ± 1.6 cm/min; shank3b– /–, N = 14, 6.4 ± 1.4 cm/min; shank3ab– /– zebrafish, N = 16, 4.6 ± 1.1 cm/min, respectively). (D) Representative traces of individual WT or shank3-deficient zebrafish in the thigmotaxis test. (E) Ratio for the distance traveled (periphery divided by the total zone) over 30 min in adult male zebrafish (3.5 mpf). WT, N = 8; shank3a– /–, N = 16; shank3b– /–, N = 24; shank3ab– /– zebrafish, N = 15. Data are shown as mean ± SEM; *P < 0.05, **P < 0.01, ***P < 0.001, ****P < 0.0001.

Core behavioral features of ASD-like displayed in shank3-deficient zebrafish. (A,B) The shoaling test showed significantly increased average inter-fish distance of adult male shank3-deficient zebrafish (3.5 mpf). WT, N = 18; shank3a– /–, N = 14; shank3b– /–, N = 13; shank3ab– /– zebrafish, N = 21. (C,D) The social preference test showed distance ratio in the conspecific sector were significantly reduced in shank3-deficient zebrafish compared to WT adult male zebrafish (3.5 mpf). WT, N = 16; shank3a– /–, N = 14; shank3b– /–, N = 16; shank3ab– /– zebrafish, N = 15. (E,F) The Kin recognition and preference test showed significantly reduced ratio of Kin zone entering in shank3-deficient zebrafish compared to WT adult male zebrafish (3.5 mpf). WT, N = 9; shank3a– /–, N = 10; shank3b– /–, N = 12; shank3ab– /– zebrafish, N = 16. (G) Representative trace of different types of stereotyped behaviors of shank3-deficient adult male zebrafish (3.5 mpf). (H)shank3-deficient zebrafish had a significantly higher proportion of stereotyped movements than WT zebrafish. WT, N = 12; shank3a– /–, N = 14; shank3b– /–, N = 14; shank3ab– /– zebrafish, N = 16. Data are presented as mean ± SEM; *P < 0.05, **P < 0.01, ***P < 0.001, ****P < 0.0001.

shank3 deficiency resulted in the reduction of synapse-related proteins in adult zebrafish brain. (A,B) Quantitative immunoblot blot analysis showed that the neuron protein NeuN was significantly decreased (50% of WT) in the shank3ab– /– male zebrafish brain relative to WT zebrafish (3.5 mpf). (C,D) The expression of post-synaptic homer1 protein was markedly reduced in shank3ab– /– male zebrafish brain compared with that of WT zebrafish (3.5 mpf, 10% of WT). (E,F) The expression of presynaptic synaptophysin protein was significantly reduced in shank3ab– /– male zebrafish brain compared with that of WT zebrafish (3.5 mpf, 36% of WT). N = 3 for each group. Data are presented as mean ± SEM; *P < 0.05, **P < 0.01.

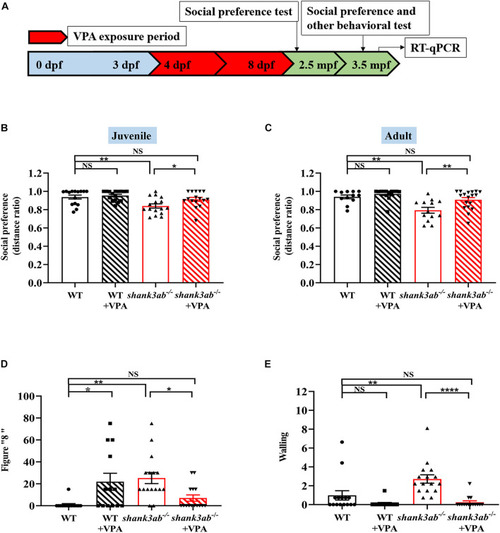
Improved ASD core symptoms in shank3-deficient zebrafish upon early VPA treatment. (A) Schematic overview of the protocol used for the VPA exposure period, the evaluation of behavioral tests at juvenile (2.5 mpf) and adult (3.5 mpf), and RT-qPCR analysis at 4.5 mpf. Red color indicates the VPA exposure phases. (B) Social preference index (distance ratio) of social test on juvenile zebrafish, WT, n = 15; WT-VPA, n = 16; shank3ab– /–, n = 16; shank3ab– /– -VPA, n = 16. (C) Social preference index (distance ratio) of social test on adult zebrafish, WT, n = 12; WT-VPA, n = 14; shank3ab– /–, n = 13; shank3ab– /– -VPA, n = 18. (D) The VPA treatment reduced abnormal proportion of stereotypic figure “8” swimming and (E) back and forth swimming (walling) in shank3ab– /– zebrafish, WT, n = 15; WT-VPA, n = 13; shank3ab– /–, n = 16; shank3ab– /– -VPA, n = 15. Data are shown as mean ± SEM. Statistical analyses: (B) one-way ANOVA with LSD correction for multiple testing. (C–E) One-way ANOVA with Bonferroni correction for multiple testing. Data are presented as mean ± SEM; *P < 0.05, **P < 0.01, ****P < 0.0001.

Increased grm5 expression level in shank3-deficient zebrafish upon early VPA treatment. (A,B) Quantitative immunoblot blot analysis showed that the expression level of neuron protein NeuN was not significantly restored in the brain of shank3ab– /– zebrafish treated with VPA relative to WT zebrafish (2 mpf). Similarly, the expressions of post-synaptic homer1 protein (C,D) and presynaptic synaptophysin protein (E,F) were not significantly increased in in the brain of shank3ab– /– zebrafish treated with VPA relative to WT zebrafish (2 mpf). (G) The relative mRNA expression levels of grm1a, grm1b, and grm5a at 4.5 mpf were detected. Each group n = 3. Data are shown as mean ± SEM. *P < 0.05, **P < 0.01.

Acknowledgments
This image is the copyrighted work of the attributed author or publisher, and ZFIN has permission only to display this image to its users. Additional permissions should be obtained from the applicable author or publisher of the image. Full text @ Front. Neurosci.