FIGURE SUMMARY
Title

Growth Hormone Overexpression Induces Hyperphagia and Intestinal Morphophysiological Adaptations to Improve Nutrient Uptake in Zebrafish

Authors
Meirelles, M.G., Nornberg, B.F., da Silveira, T.L.R., Kütter, M.T., Castro, C.G., Ramirez, J.R.B., Pedrosa, V., Romano, L.A., Marins, L.F.
Source
Full text @ Front. Physiol.

Gh-transgenic zebrafish (Danio rerio). The F0104 line was developed from the co-injection of two separate transgenes, both containing the carp β-actin promoter (Cyprinus carpio), which controls the expression of the GFP gene from the jellyfish Aequorea victoria or the GH gene from the marine silverside fish (Odonthestes argentinensis). Linearized transgenes were co-injected in an equimolar ratio into zebrafish zygotes to provide the same genome integration and expression (Figueiredo et al., 2007). In the F0104 line, GFP expression works not only as a marker of transgenesis but also allows mapping the tissues that are expressing GH since both GFP and GH are under the control of the same gene promoter.

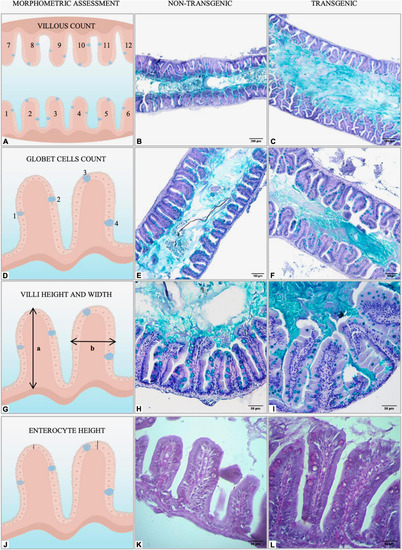
Graphical representation of morphometric analysis performed in the intestine of non-transgenic and gh-transgenic zebrafish (D. rerio) siblings. (A) Intestinal folds were manually counted in six fields randomly sampled for each animal using the multipoint tool from ImageJ. Representative Alcian blue-stained sections of midgut cross-sections from (B) non-transgenic and (C)gh-transgenic zebrafish. Magnification: ×10, scale bar: 200 μm. (D) The number of intestinal goblet cells was determined by manually counting all cells in six randomly sampled fields for each animal using the multipoint tool from ImageJ. Representative images of midgut sections stained for the goblet cell marker Alcian blue from (E) non-transgenic and (F)gh-transgenic zebrafish. Magnification: ×20, scale bar: 100 μm. (G) Intestinal villus height (a) and width (b) were manually measured in the anterior and middle intestine from 24 individual villi randomly sampled for each animal using the segmented line tool from ImageJ. Representative Alcian blue-stained sections of anterior intestine from (H) non-transgenic and (I)gh-transgenic zebrafish. Magnification: ×40, scale bar: 50 μm. (J) Enterocyte height was manually measured in the anterior intestine from 24 individual villi randomly sampled for each animal using the segmented line tool from ImageJ. Representative Periodic acid-Schiff (PAS) stained sections of anterior intestine from (K) non-transgenic and (L)gh-transgenic zebrafish. Magnification: ×40, scale bar: 50 μm, n = 18 non-transgenic and 18 gh-transgenic zebrafish.

Growth performance and feed intake of gh-transgenic zebrafish (D. rerio). Body weight (A), length (B), SGR (C), weight gain (D), and feed intake (E) were significantly increased in response to GH excess in transgenic zebrafish compared to non-transgenic full siblings. Weight (mg) and length (mm) were measured every 15 days during the 60-day growth experiment (non-transgenic, n = 38, and gh-transgenic fish, n = 37). Differences in body weight between the two groups were determined by linear regression analysis. ANOVA with multiple comparisons was performed between the two genotypes at each time point for weight gain and body length. Comparisons of SGR and feed intake between two groups were taken by a two-tailed t-test. Data are shown as means ± SE of 37 fish per group. Asterisks indicate significant differences (*p < 0.05; **p < 0.01; ***p < 0.001; and ****p < 0.0001). Zebrafish that overexpress GH exhibited a linear increase in growth (p < 0.05). gh, growth hormone gene; NT, Non-Transgenic; T, Transgenic.

Intestinal absorptive area of gh-transgenic zebrafish (D. rerio). Intestinal length (A), intestinal mass (B), and enterosomatic index (ESI) (C) were significantly increased in response to GH excess in transgenic zebrafish compared to non-transgenic full siblings. Data are shown as means ± SE of 37 fish per group. Gh-transgenic zebrafish show a significantly enhancement of villus height (D), villus width (E), and length of enterocyte (F) with respect to the control. Differences in all intestinal parameters between the two groups were determined using a two-tailed t-test. Data are shown as mean ± SE of 18 fish per group. Asterisks indicate significant differences (*p < 0.05; ***p < 0.001; and ****p < 0.0001). NT, non-transgenic; T, transgenic.

Ultrastructure of the intestinal microvilli of gh-transgenic zebrafish (D. rerio). Electron micrographs show organized microvilli on the apical surface in the enterocyte of non-transgenic (A) and gh-transgenic zebrafish (B) siblings. No difference in surface area of microvillus from the anterior intestine was detected between the groups (p > 0.05). Magnification: ×25.000, scale bar: 1 μm.

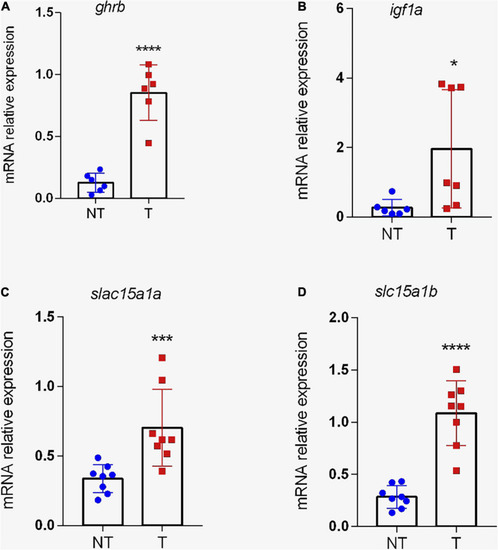
Expression of genes related to growth and peptide transport in the intestine of transgenic zebrafish (D. rerio). Relative ghrb(A), igf1a(B), slc15a1a(C), and slc15a1b(D) gene expression normalized against eef1α and rpl13a in intestine from non-transgenic and gh-transgenic zebrafish. The transgenic group shows a significant increase in mRNA expression of ghrb, igf1a, and for the two genes that encode to PEPT1 transporter (slc15a1a and slc15a1b). The differences in relative mRNA expression between the two groups were determined using a two-tailed t-test. Data are shown as mean ± SD. Asterisks indicate significant differences (*p < 0.05, ***p < 0.001; and ****p < 0.0001). NT, non-transgenic; T, transgenic.

Acknowledgments
This image is the copyrighted work of the attributed author or publisher, and ZFIN has permission only to display this image to its users. Additional permissions should be obtained from the applicable author or publisher of the image. Full text @ Front. Physiol.