FIGURE SUMMARY
Title

FGF-2 promotes angiogenesis through a SRSF1/SRSF3/SRPK1-dependent axis that controls VEGFR1 splicing in endothelial cells

Authors
Jia, T., Jacquet, T., Dalonneau, F., Coudert, P., Vaganay, E., Exbrayat-Héritier, C., Vollaire, J., Josserand, V., Ruggiero, F., Coll, J.L., Eymin, B.
Source
Full text @ BMC Biol.

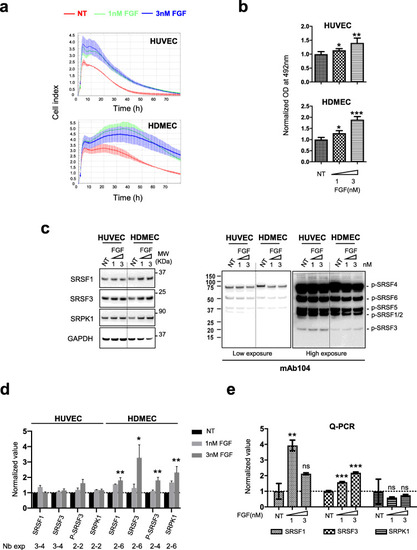
FGF-2 increases SRSF1, SRSF3 and SRPK1 protein levels in primary endothelial cells. a, b xCELLigence (a) or MTS (b) assay was used to assess HUVEC and HDMEC cellular adhesion, proliferation, and viability in response to FGF-2 at 1 or 3nM. Data are representative of at least 2 independent experiments performed in at least triplicate (mean ± SD, unpaired t test, **p<0.01; ***p<0.001). c Representative immunoblots for SRSF1, SRSF3, SRPK1 (left panel), and phospho-SR (p-SR) (mAb104, right panel, two exposure times) protein levels in HUVEC and HDMEC, respectively, treated with 1 or 3nM FGF-2 for 72 h. GAPDH was used as a loading control. NT: nontreated. d Semi-quantification using ImageJ software of SRSF1, SRSF3, P-SRSF3, or SRPK1 signal relative to GAPDH signal. Ratio obtained for NT group was arbitrarily assigned the value 1. Numbers below the graph indicate the number of biological replicates for each condition (mean ± SD, unpaired t test, *p<0.05, **p<0.01). e HDMEC were treated with 1 or 3nM FGF-2 as in (c). SRSF1, SRSF3, and SRPK1 mRNA levels were quantified by RT-qPCR in each condition. GAPDH was used as an internal control. Mean ± SEM are presented (n=4, unpaired t test, **p< 0.01, ***p<0.001, ns: not significant)

FGF-2-mediated HUVEC survival requires SR proteins accumulation and phosphorylation. a HUVEC were plated for 24 h in full medium, then cultured for 6 additional hours in EBM-2 basal medium supplemented (FGF) or not (-FGF/NT) with 3nM FGF-2 as indicated. Upper panel: immunoblot for cleaved-caspase 3. Tubulin was used as a loading control. Lower panel: semi-quantification of cleaved-caspase 3 signal relative to tubulin signals versus the values of the NT group by ImageJ (n=3, unpaired t test, ***p<0.001). b, d Immunoblots for SRSF1, SRSF3, and SRPK1 (b) or phospho-SR (d) proteins in HUVEC treated (FGF) or not (NT) with 3nM FGF-2 for 6 or 24 h as in (a). GAPDH was used as a loading control. c, e Semi-quantification by ImageJ of the indicated proteins signals relative to GAPDH signal. The ratio obtained for the NT group was arbitrarily assigned the value 1 (c, n=4; e, n=3; unpaired t test, *p<0.05, **p<0.01, ns: not significant). fLeft and middle panels: representative immunoblots of SRSF1 and SRSF3 protein levels (left) or RT-qPCR analyses of Srsf1 and Srsf3 mRNA levels (middle) in HUVEC transfected during 48 h with either control (Mis), SRSF1 (Srsf1), or SRSF3 (Srsf3) siRNA as indicated. A 50:50 mixture of two distinct SRSF1 or SRSF3 siRNAs was used (n=4; unpaired t test, ***p<0.001, ns: not significant). Right panel: cell viability quantified by using trypan blue exclusion counting in HUVEC just before plating for xCELLigence assay. Mean ± SD are presented (siRNA group mismatch, n=3; siRNA group Srsf1, n=2; siRNA group Srsf3, n=3). g xCELLigence assay on HUVEC transfected with the indicated siRNA and treated or not with 3nM FGF-2 (n=3)

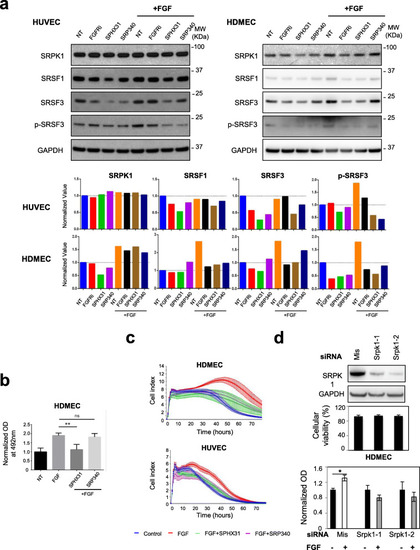
FGF2-mediated endothelial cells proliferation and survival requires SRPK1 activity. aUpper panel: immunoblots of the indicated proteins in HUVEC (left) and HDMEC (right) treated or not (NT) for 72 h with 10nM AZD4547 (FGFRi), 5μM SPHINX31 (SPHX31), or 10μM SRPIN340 (SRP340) in the presence or absence of 3nM FGF-2 as indicated. GAPDH was used as a loading control. Data representative of 2 (HUVEC) and 3 (HDMEC) independent experiments are presented. Lower panel: semi-quantification using ImageJ software of the signals obtained for the indicated proteins relative to GAPDH signal. The ratio obtained for the NT group was arbitrarily assigned the value 1. b MTS test was used to quantify HDMEC cellular viability in response to 72 h treatment with or without 3nM FGF-2 in the presence or absence of 5μM SPHINX31 (SPHX31) or 10μM SRPIN340 (SRP340) (n=4 technical replicates, unpaired t test, **p<0.01, ns: not significant). c xCELLigence assay was used to assess HUVEC and HDMEC cell adhesion, proliferation, and viability in response to 3nM FGF-2 with or without 5μM SPHINX31 (SPX31) or 10μM SRPIN340 (SRP340) (n=3). d HDMEC was transfected for 48 h with either mismatch (mis) or distinct SRPK1 siRNAs as indicated. Upper panel: representative immunoblot of SRPK1 knockdown. GAPDH was used as a loading control (n=3). Middle panel: cellular viability (%) was assessed after trypan blue staining in transfected HDMEC just before plating (n=5). Lower panel: MTS assay was used to quantify cellular viability in HDMEC deprived of SRPK1 (Srpk1) or not (Mis) and treated (+) or not (−) with 3nM FGF-2 for 48 h. Mean ± SD (n=3; unpaired t test, *p<0.05)

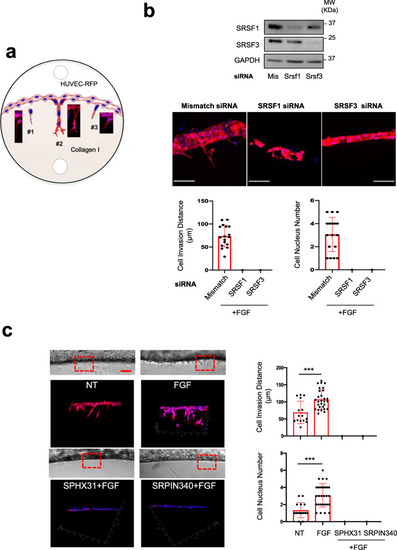
SRSF1/SRSF3 knockdown and SRPK1 inhibitors abrogate HUVEC-RFP invasion and sprouting in 3D collagen matrix. a Schematic representation of 3 different types of endothelial cell HUVEC-RFP behavior. #1: aborted endothelial cell sprouting, endothelial cells invade the collagen matrix without being followed by stalk cells; #2: capillary formation, complete process of endothelial cell invasion and sprouting. Filopodia projecting from the tip cells are observed; #3 early step of endothelial cell responses. For quantification, cell responses were scored according to these 3 types of cell behavior. b HUVEC-RFP were transfected for 48 h with control siRNA (mismatch) or a 50:50 mixture of two different SRSF1 (SRSF1) or SRSF3 (SRSF3) siRNAs before being analyzed in 3D invasion assay. Upper panel: immunoblots showing the efficient knockdown of SRSF1 or SRSF3 in HUVEC-RFP. GAPDH was used as a loading control. Lower panels: mosaic of confocal images covering around 300 μm of matrices border for different HUVEC-RFP post-transfection with indicated siRNA. HUVEC-RFP cells are in red and nuclei in blue. Scale bar = 100μm. Bar charts represent the quantifications of the invading distance of HUVEC-RFP within the 3D collagen matrices and the number of invading cells (nuclei) per 300 μm of gel border. Each black dot indicates one invading sprout. c HUVEC-RFP cells were treated or not (NT) with 3nM FGF-2 for 24 h in the presence or absence of 5μM SPHINX31 or 10μM SRPIN340 before performing 3D invasion assay. Left top panels: transmission light microscopy images showing invasive capacities of HUVEC-RFP within the 3D collagen gels. Left bottom panels: mosaic of confocal images covering around 300 μm of matrices border. HUVEC-RFP cells are in red and nuclei in blue. Scale bar = 100μm. Right panel: Bar charts represent the quantification of the invading distance of HUVEC- RFP within the 3D collagen matrices (top) and the number of invading cells (nuclei) per 300 μm of gel border (bottom). Each black dot indicates one invading sprout. b, c Graphs represent mean values ± SD of three independent experiments. Unpaired t test, ***p<0.001

Endothelial cells accumulate SRSF1/3 and SRPK1 proteins upon FGF-2 treatment in an in vivo sponge assay. a Cellulose sponges loaded with FGF-2 or with PBS were engrafted under the skin of mice (n=6/group). As indicated in the graph, cellulose sponges were repeatedly injected. After 7 days, the sponges were collected and lysed for total protein extraction. b Representative immunoblots of SRPK1, SRPK2, SRSF1, and SRSF3 proteins from sponges treated with PBS or FGF-2. Tubulin was used as a loading control. c Semi-quantification using ImageJ software of FGF-2 effects on the indicated proteins relative to tubulin signals. The ratio obtained in PBS condition was arbitrarily assessed the value 1. Graphs represent mean values ± SD of 3 independent protein extracts (t test, *p<0.05, ***p<0.001, ns: not significant)

SRPIN340 treatment perturbs intersegmental vessels (ISV) sprouting and DLAV formation in zebrafish embryos. a The schedule sketch indicates the protocol used for drug treatment of Tg(fli1:EGFP) Casper embryos. b Immunofluorescence image of the vasculature of a Tg(fli1:EGFP) embryo at 42hpf (Left). Box represents the zoom area showing the trunk vasculature (Right). DLAV, dorsal longitudinal anastomic vessel; ISV, intersegmental vessel; DA, dorsal aorta; PCV, posterior cardinal vein. c Confocal images of EGFP+ vessels in the trunk of Tg(fli1:EGFP) zebrafish embryos at 28hpf (upper panel) and 42hpf (lower panel) after exposure to DMSO (as vehicle control), SSR or SRPIN 340 at 100μM. Arrows indicate disrupted ISVs. Stars point to incomplete DLAV formation. d Quantification of blood vessel formation defects. (Left) Quantification of ISV length with ImageJ software. Each value corresponds to the mean of length measurement of at least ten ISVs in the trunk of a same embryo. * represents a significant statistical difference between the indicated groups (one-way ANOVA test; ****p<0.0001). (Right) Quantification of DLAV phenotype scored as absent, interrupted, or complete in 42 hpf Tg(fli1:EGFP) embryos treated or not with SSR or SRPIN 340. Values are expressed in percentage of the total embryos analyzed in each condition. n = number of embryos

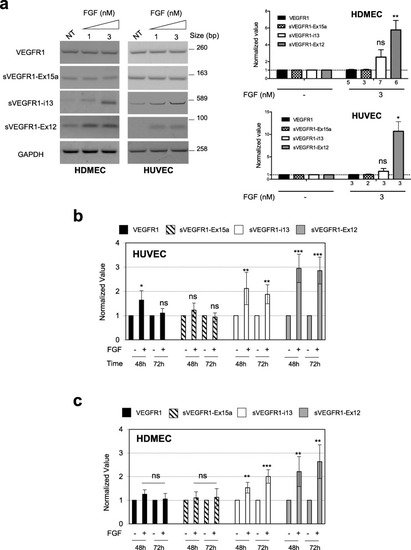
FGF-2 leads to the accumulation of sVEGFR1 splice variants in endothelial cells. a Dose effects of FGF-2 in HUVEC and HDMEC treated or not (NT) for 72 h with increasing concentrations of FGF-2. Left panel: representative RT-PCR analyses of VEGFR1 and sVEGFR1-ex15a, sVEGFR1-i13, and sVEGFR1-ex12 splice variants. GAPDH was used as an internal control. Right panel: semi-quantification using ImageJ software of PCR-specific signals related to GAPDH signal in 3nM FGF-2-treated cells. Ratio obtained in nontreated (NT) condition was arbitrarily assigned the value 1 (mean ± SD, unpaired t test, *p<0.05, **p<0.01, ns: not significant). Numbers below the graph indicate the number of biological replicates for each condition. b, c RT-qPCR analyses of VEGFR1 (black bars), sVEGFR1-ex15 (hatched bars), sVEGFR1-i13 (white bars), and sVEGFR1-ex12 (gray bars) mRNA levels in HUVEC (b) or HDMEC (c) treated or not with 3nM FGF-2 for 48 or 72 h as indicated. GAPDH was used as an internal control. Mean ± SD are presented (n=6; 2 technical replicates of 3 biological replicates excepted for VEGFR-1 and sVEGFR1-ex15 at 48 h n=4; 2 technical replicates of 2 biological replicates, unpaired t test, *p<0.05, **p<0.01, ***p<0.001, ns: not significant)

FGF-2 mediates accumulation of sVEGFR1 splice variants through a SRSF1/SRSF3/SRPK1-dependent axis. a HDMEC were transfected with control siRNA (mis) or specific SRSF1 (Srsf1) or SRSF3 (Srsf3) siRNA and treated with 3nM FGF-2 for 72 h. Left panel: representative immunoblots of SRSF1 or SRSF3 protein (WB) or PCR analyses (RT-PCR) of sVEGFR1-i13 and sVEGFR1-ex12 mRNA levels. GAPDH was used as a loading/internal control. Right panel: PCR data semi-quantification by ImageJ software. The sVEGFR1/GAPDH ratio obtained in control condition was arbitrarily assigned the value 1. Data are the mean ± SD of 3 and 4 biological replicates for sVEGFR1-ex12 and sVEGFR1-i13, respectively (unpaired t test, **p<0.01, ***p<0.001, ns: not significant). b sVEGFR1-i13 and sVEGFR1-ex12 mRNA levels were quantified by RT-qPCR in HUVEC transfected with either control siRNA (mis) or specific SRSF1 or SRSF3 siRNA and treated with 3nM FGF-2 for 48 h. GAPDH was used as an internal control. Mean ± SD are presented (n=3 biological replicates, unpaired t test, ***p<0.001, ****p<0.0001, ns: not significant). c, d VEGFR1 (R1), sVEGFR1-ex15 (R1-Ex15), sVEGFR1-i13 (R1-i13), and sVEGFR1-ex12 (R1-Ex12) mRNA levels were quantified by RT-qPCR in HUVEC (c) or HDMEC (d) treated (FGF, white bars) or not (NT, black bars) with 3nM FGF-2 for 48 h (HUVEC) or 72 h (HDMEC) in the presence or absence of 10nM AZD4547 (FGFRinh, gray bars), 10μM SRPIN340 (SRPIN340, black hatched bars), or 5μM SPHINX31 (SPHINX31, gray hatched bars). GAPDH was used as an internal control. Mean ± SD are presented (n=6; 2 technical replicates of 3 independent experiments, unpaired t test, *p<0.05, **p<0.01, ***p<0.001, ****p<0.0001, ns: not significant). e Quantification by ELISA assay of sVEGFR1 protein level in HDMEC supernatants collected 1 day or 3 days after treatment with or without (control) 3nM FGF-2 and 5μM SPHINX31 or 10μM SRPIN340. Data represent the mean ± SD of 3 (day 2) or 5 (day 4) independent experiments. t test, *p< 0.05, **p< 0.01, ***p<0.001, and **** p<0.0001

sVEGFR1-ex12 contributes to FGF-2 pro-angiogenic functions in endothelial cells. a The schedule sketch indicates the protocol used to generate sVEGFR1-i13 or sVEGFR1-ex12 knockeddown HUVEC-RFP cells by siRNA and to collect endothelial cells for xCELLigence (b) or 3D invasion (c) assay, respectively. bUpper left panel: sVEGFR1-i13 and sVEGFR1-ex12 mRNA levels were quantified by RT-qPCR in HUVEC-RFP transfected with either control siRNA (mis, black bars) or with a mixture (50:50) of two distinct siRNA against either sVEGFR1-i13 (white bars) or sVEGFR1-ex12 (grey bars). GAPDH was used as an internal control. Mean ± SD are presented (n=4; 2 technical replicates of 2 independent experiments, t test, *p<0.05, **p<0.01, ***p<0.001). Lower left panel: cellular viability quantified by using trypan blue exclusion counting in HUVEC-RFP just before plating for xCELLigence assay (mean ± SD, n=3; unpaired t test, ns: not significant). Right panel: xCELLigence assay was used to test FGF-2 (3nM) effects on adhesion/proliferation/survival of sVEGFR1-i13 or sVEGFR1-Ex12 depleted HUVEC-RFP (n=3). Mismatch siRNA was used as a positive control to ensure FGF-2 protective effects on cell viability in this experimental design. c 3D invasion assay in collagen I gels. Left panels: mosaic of confocal images covering around 300 μm of matrices border for HUVEC-RFP transfected with the indicated siRNA. HUVEC-RFP cells are in red and nuclei in blue. Scale bar = 100μm. Right panels: bar charts of the quantification of the invading distance of HUVEC-RFP within the 3D collagen matrices and the number of invading cells (nuclei) per 300 μm of gel border. Each black dot indicates one invading sprout. Graphs represent mean values ± SD (n=3; t test, *p<0.05, **p<0.01). dLeft panels: confocal illustrations of the impact of the peptide p12 that blocks the interaction between sVEGFR1 and β1 integrin or a control scramble peptide on FGF-2-mediated HUVEC-RFP sprouting/invasion in collagen I gels (n=3). Scale bar is 100 μm. Right panels: Bar charts of the quantification of invading distance and the number of invading cells as indicated above (mean values ± SD, unpaired t test, *p<0.05, ns: not significant)

sVEGFR1-ex12 is a poor prognosis marker in squamous lung carcinoma patients. a, b Different sVEGFR1-exon12 usage value (exon expression value divided by gene expression value) between squamous lung carcinoma patients displaying low (<median, 1st and 2nd quartiles, n=243) and high (≥median, 3rd and 4th quartiles, n=244) FGF-2 (a) or FGFR1 (b) mRNA levels. Data is presented with mean ± SD. p values were calculated with an unpaired t test, ***p<0.001. c Overall survival analysis stratified according to sVEGFR1-exon12 usage value in squamous lung carcinoma patients for who clinical annotations were available (n=411). Low indicates the value below the median level (n=205) and high indicates values above the median level (n=206). The p value was calculated using a log-rank test

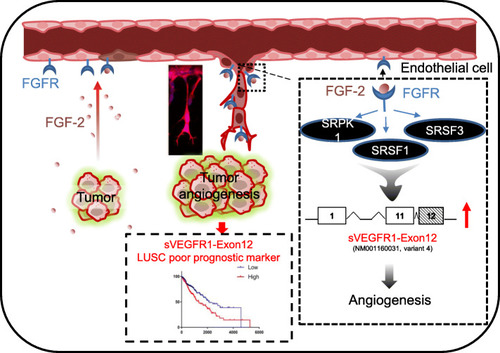
Graphical abstract for FGF-2-dependent regulation of sVEGFR1 splice variants in endothelial cells and its contribution to angiogenesis and lung tumorigenesis. In endothelial cells, FGF-2 stimulates a SRPK1/SRSF1/SRSF3 signaling pathway that controls VEGFR1 splicing in favor of sVEGFR1 splice variants, in particular sVEGFR1-ex12 (variant 4), that contribute to FGF-2 pro-angiogenic functions. In squamous lung carcinoma patients (LUSC), elevated sVEGFR1-ex12 usage value correlates with FGF-2/FGFR1 mRNA levels and with poor prognosis, thereby supporting a role of the FGF-2/FGFR1/sVEGFR1-ex12 signaling network in both physiological and pathological angiogenesis

Acknowledgments
This image is the copyrighted work of the attributed author or publisher, and ZFIN has permission only to display this image to its users. Additional permissions should be obtained from the applicable author or publisher of the image. Full text @ BMC Biol.