Mitochondrial homeostasis in WT and mpv17a9/a9 neuromasts. (A,B) Maximum-intensity projections of confocal images showing CellROX Green staining in WT siblings (A) and mpv17a9/a9(B) neuromasts. Neuromast boundaries were delineated based on DIC images (not shown). (C) Mean CellROX intensity is elevated in mpv17a9/a9 neuromasts (****P < 0.0001). n = 21–23 neuromasts; N = 2 experimental trials. (D,E) Maximum-intensity projections of confocal images showing mitoGCaMP3 fluorescence in WT (D) and mpv17a9/a9(E) neuromasts. (F) Mean mitoGCaMP3 intensity is increased in mpv17a9/a9 neuromasts (****P < 0.0001). n = 30–35 neuromasts (L3, L4, and L5); N = 2 experimental trials. Scale bars: 5 μm. Error bars: SEM.

mpv17a9/a9 hair cells have hyperpolarized mitochondria. (A–C, E–G) Maximum-intensity projections of confocal images displaying WT (A–C) and mpv17a9/a9(E–G) neuromasts with DAPI-labeled hair cells (A–E) and staining with MitoTracker Red CMXRos (B–F) and MitoTracker Deep Red (C–G). (D–H) Mean intensities for both MitoTracker Red CMXRos (D) and MitoTracker Deep Red (H) are elevated in mpv17a9/a9 neuromasts (*P = 0.0469; ****P < 0.0001). n = 29–31 neuromasts (L3, L4, and L5); N = 4 experimental trials. Scale bar: 5 μm. Error bars: SEM.

FM1-43 uptake is reduced in mpv17a9/a9 hair cells. (A,B) Maximum-intensity projections of confocal images showing WT (A) and mpv17a9/a9(B) neuromasts exposed to FM1-43FX. (C) Mean intensity of FM1-43FX is reduced in mpv17a9/a9 neuromasts (***P = 0.0002). n = 42–44 neuromasts (L3, L4, and L5); N = 4 experimental trials. Scale bar: 5 μm. Error bars: SEM.

mpv17a9/a9 larvae are more sensitive to neomycin-induced hair-cell loss. (A–D) Maximum-intensity projections of confocal images of WT (A,B) and mpv17a9/a9(C,D) control neuromasts (A–C) or exposed to 10 μM neomycin (B,D). Hair cells were visualized with immunolabel of Parvalbumin (magenta), afferent neurites are expressing GFP (green), and all cell nuclei are labeled with DAPI (blue). (E) Dose-response curves showing hair cell survival as a percentage of control in both WT and mpv17a9/a9 neuromasts (*P = 0.0115; ***P = 0.0001; ****P < 0.0001). n = 67–86 neuromasts (L3, L4, and L5); N = 3 experimental trials. Scale bar: 5 μm. Error bars: SD.

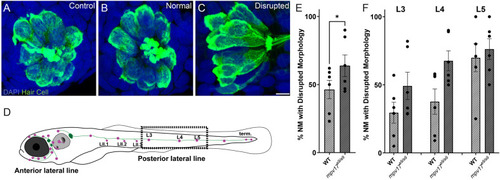
Mechanical overstimulation results in morphological disruption of neuromasts more frequently in mpv17a9/a9 larvae than in WT. (A–C) Maximum-intensity projections of confocal images showing hair cells labeled with Parvalbumin and all nuclei labeled with DAPI in control neuromasts (A) and strong water current exposed neuromasts with normal (B) or disrupted (C) morphology. (D) Schematic of larval zebrafish indicating the placement of neuromasts (pink dots) and afferent nerves (green lines). Neuromasts L3, L4, and L5 (dashed rectangle) were examined in this study. (E,F) Quantification of disrupted neuromasts, both overall (E) and separated by position on the body (F). Each point indicates the percentage of neuromasts with disrupted morphology in a single experimental trial. The frequency of disrupted neuromasts was higher in the more posterior L5 neuromasts; mpv17a9/a9 neuromasts showed disrupted morphology more frequently than WT (*P = 0.0232). n = 9–64 neuromasts (L3, L4, and L5) per trial; N = 6 experimental trials. Scale bar: 5 μm. Error bars: SEM.

WT and mpv17a9/a9 neuromasts show loss of hair cells and afferent innervation following mechanical overstimulation. (A–F) Maximum-intensity projections of confocal images showing neuromasts with Parvalbumin-labeled hair cells (blue) and Ribeye b-labeled presynaptic ribbons (magenta). Neurod:GFP-labeled afferent neurites are also shown (green). Unexposed control neuromasts are shown in (A; WT) and (D; mpv17a9/a9); exposed neuromasts with normal morphology are shown in (B; WT) and (E; mpv17a9/a9); and exposed neuromasts with disrupted morphology are shown in (C; WT) and (F; mpv17a9/a9). Arrows indicate hair cells lacking afferent innervation. (G,H) Quantification of average hair cells per neuromast shows a trend of hair cell loss in exposed neuromasts (G), which is specific to disrupted neuromasts (H; **P = 0.0037). n = 32–66 fish (neuromasts L3, L4, and L5); N = 9 experimental trials. (I,J) The average percentage of hair cells with GFP-labeled contacts. We observed significant neurite retraction [I; **P = 0.0020 (WT); ***P = 0.0010 (mpv17a9/a9)], which is also specific to disrupted neuromasts only [J; **P = 0.0039 (WT); **P = 0.0020 (mpv17a9/a9)]. n = 15–30 fish (neuromasts L3, L4, and L5); N = 6 experimental trials. Scale bar: 5 μm. Error bars: SEM. “ns” = not significant.

Both WT and mpv17a9/a9 neuromasts experience mechanically induced hair-cell synapse loss. (A–C) Maximum-intensity projections of confocal images showing neuromasts with Parvalbumin-labeled hair cells (blue), Ribeye b-labeled presynaptic ribbons (magenta), and MAGUK-labeled PSD (green). Unexposed control neuromasts are shown in (A; WT) and (D; mpv17a9/a9); exposed neuromasts with normal morphology are shown in (B; WT) and (E; mpv17a9/a9); and exposed neuromasts with disrupted morphology are shown in (C; WT) and (F; mpv17a9/a9). (G,H) Quantification of average numbers of intact synapses per hair cell. Each data point refers to the average number of intact synapses per hair cell in one neuromast per fish. Synapse number is reduced in both WT and mpv17a9/a9 neuromasts (G; **P = 0.0020 WT; *P = 0.0313 mpv17a9/a9). This reduction was consistent in both normal and disrupted neuromasts (H; *P = 0.0483 WT normal; *P = 0.0272 WT disrupted). n = 13–36 fish (neuromasts L3, L4, and L5); N = 7 experimental trials. Scale bar: 5 μm. Error bars: SEM. “ns” = not significant. PSD, postsynaptic density.

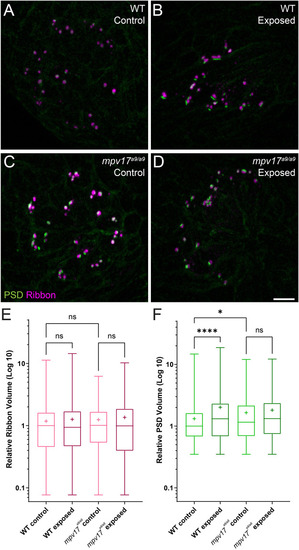
Figure 8. PSDs are enlarged in mpv17a9/a9 neuromasts but do not significantly change upon mechanical overstimulation. (A–D) Maximum-intensity projections of confocal images of WT (A,B) and mpv17a9/a9 (C,D) neuromasts, either unexposed (A–C) or exposed to strong water current (B,D). (E) Quantification of presynaptic ribbon volume relative to unexposed WT control. n = 1013–1087 presynaptic particles; N = 7 experimental trials. (F) Quantification of PSD volume relative to WT control. PSDs are enlarged in unexposed mpv17a9/a9 neuromasts and mechanically overstimulated WT neuromasts, but there is no significant change in PSD size in mechanically overstimulated mpv17a9/a9 neuromasts (****P < 0.0001 WT exposed; *P = 0.0100 mpv17a9/a9 control). n = 486–683 PSD particles from neuromasts L3, L4, and L5; N = 5 experimental trials. Scale bar: 5 μm. Whiskers: min. to max. values; “+” indicates mean value. “ns” = not significant.

Acknowledgments
This image is the copyrighted work of the attributed author or publisher, and ZFIN has permission only to display this image to its users. Additional permissions should be obtained from the applicable author or publisher of the image. Full text @ Front. Cell. Neurosci.