
- Title
-
Identification of de novo EP300 and PLAU variants in a patient with Rubinstein-Taybi syndrome-related arterial vasculopathy and skeletal anomaly
- Authors
- Park, J.E., Kim, E., Lee, D.W., Park, T.K., Kim, M.S., Jang, S.Y., Ahn, J., Park, K.B., Kim, K.H., Park, H.C., Ki, C.S., Kim, D.K.
- Source
- Full text @ Sci. Rep.
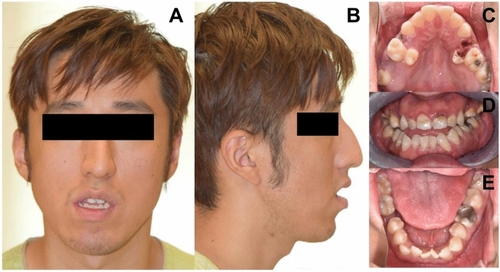
Facial and dental characteristics of the patient. The face was long and narrow and showed signs of third nerve palsy, grimacing smile, pinched and hump nose, maxillary retrognathia compared to the mandible, and skeletal Class III malocclusion without microencephaly ( |
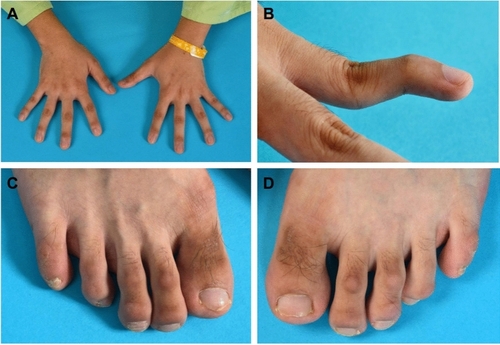
Skeletal findings of the patient. The hands showed brachydactyly ( |

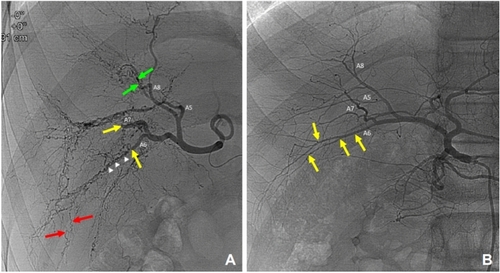
Right vertebral artery angiography of the patient. Anterior–posterior view of the right vertebral artery (A,B). Compared with the normal perforator (yellow arrow), the perforators of both posterior cerebral arteries (black arrows) were tortuous and dilated. Short segmental dilatation and aneurysm formation of the right anterior inferior cerebellar artery (red arrow) was noted. |
Comparison of visceral angiograms between the patient’s hepatic artery ( |

Electropherograms of |
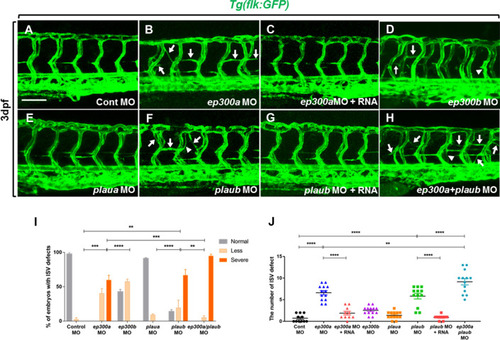
Knockdown of PHENOTYPE:
|
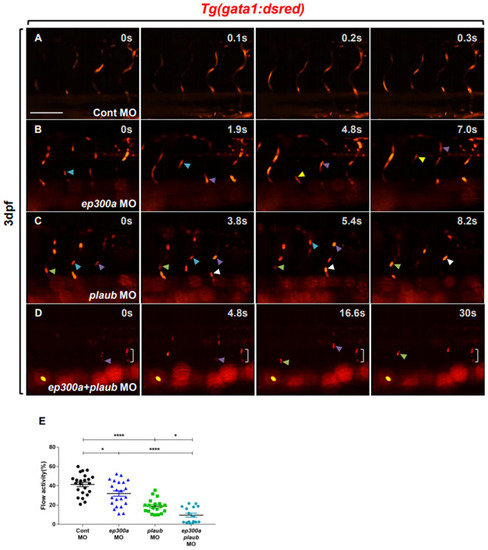
Knockdown of PHENOTYPE:
|