
- Title
-
Size matters: Large copy number losses in Hirschsprung disease patients reveal genes involved in enteric nervous system development
- Authors
- Kuil, L.E., MacKenzie, K.C., Tang, C.S., Windster, J.D., Le, T.L., Karim, A., de Graaf, B.M., van der Helm, R., van Bever, Y., Sloots, C.E.J., Meeussen, C., Tibboel, D., de Klein, A., Wijnen, R.M.H., Amiel, J., Lyonnet, S., Garcia-Barcelo, M.M., Tam, P.K.H., Alves, M.M., Brooks, A.S., Hofstra, R.M.W., Brosens, E.
- Source
- Full text @ PLoS Genet.
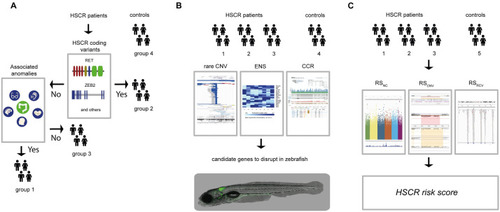
(A) For this study we included 326 controls (group 4) and 58 HSCR patients. We determined the RET and / or known disease gene coding mutations of HSCR patients (n = 58). The HSCR patients with coding mutations were included in group 2 (n = 15). We determined the presence of associated anomalies in the rest of the HSCR patients, including them in either the group containing associated anomalies (HSCR-AAM; group 1, n = 23) or in the group without associated anomalies (group 3, n = 30). (B) For all subgroups of HSCR patients and the controls Copy Number profiles were determined. To select candidate genes, we ranked CNVs according to their frequency in the unaffected controls from the Deciphering Developmental Disorders project (for illustrative purposes a screenshot of their UCSC genome browser track; |
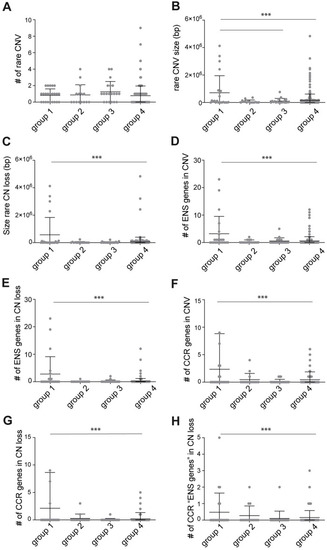
(A) Graph showing the number of rare CNVs found in the four groups. No statistical differences were found. (B) Graph showing the size in base pairs (bp) of the rare CNVs found in the four groups. Rare CNV size in group 1 (HSCR-AAM) was significantly larger than those found in group 3 (HSCR without a causal variant identified) and group 4 (controls). (C) Graph showing the size (bp) of the rare CN losses found in the four groups. Rare CN loss size in group 1 (HSCR-AAM) was significantly larger than those found in group 4 (controls). (D) Graph showing the number of “ENS genes” included in the CNVs found in the four groups. The number of “ENS genes” included in CNVs of group 1 (HSCR-AAM) was significantly higher than those found in group 4 (controls). (E) Graph showing the number of “ENS genes” included in the CN losses found in the four groups. The number of “ENS genes” included in CN losses of group 1 (HSCR-AAM) was significantly higher than those found in group 4 (controls). (F) Graph showing the number of CCR genes included in the CNVs found in the four groups. The number of CCR genes included in CNVs of group 1 (HSCR-AAM) was significantly higher than those found in group 4 (controls). (G) Graph showing the number of CCR genes included in the CN losses found in the four groups. The number of CCR genes included in CN losses of group 1 (HSCR-AAM) was significantly higher than those found in group 4 (controls). (H) Graph showing the number of “ENS genes” that are also a CCR, included in the CN losses found in the four groups. These genes were considered as the HSCR candidate genes. The number of CCR “ENS genes” included in CNVs of group 1 (HSCR-AAM) was significantly higher than those found in group 4 (controls). Each dot represents one patient. Error bars represent standard deviation. Statistical analysis used: one-way ANOVA followed by students t-test. ** p < 0.01 *** p < 0.001; Exact p-values and statistics can be found in |
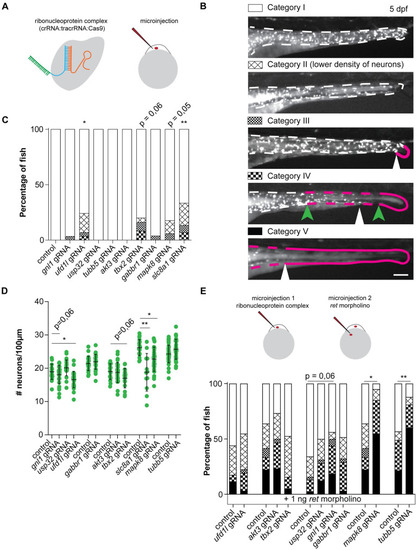
(A) Visual representation of the CRISPR/Cas9 complex injections using the Alt-R CRISPR-Cas9 System from Integrated DNA Technologies (IDT) [ PHENOTYPE:
|

(A) Figures and graphs showing that disruption of tbx2a/b in zebrafish does not result in overall significantly reduced numbers of phox2bb-GFP+ cells, however it does induce ENS phenotypes in category II and III in a significant number of zebrafish larvae. (B) Figures and graphs showing that disruption of ufd1l in zebrafish results in significantly reduced numbers of phox2bb-GFP+ cells and increase in the percentage of fish presenting with an ENS phenotype. (C) Figures and graphs showing that disruption of mapk8a/b in zebrafish does not result in overall significantly reduced numbers of phox2bb-GFP+ cells, however it does induce ENS phenotypes in a significant number of zebrafish larvae. Statistical tests used: students t-test and "N-1" Chi-squared test; * p < 0.05 ** p < 0.01 *** p < 0.001; Exact p-values and statistics can be found in PHENOTYPE:
|

(A) A second injection round targeting gnl1, using a lower dose of ret morpholino, confirmed gnl1 epistasis with Ret. Statistical tests used: "N-1" Chi-squared test; * p < 0.05 (B) Visual representation of the distribution of genetic predispositions over HSCR patient groups. In total 197 patients born between 1973 and 2018 were evaluated by a clinical geneticist in the department of Clinical Genetics, Erasmus Medical Center, Rotterdam. Of these, 114 did not have associated anomalies nor a known syndrome. 29 patients had a known HSCR related genetic syndrome, including Down syndrome (n = 18). 153 out of 197 patients were genetically evaluated for RET gene involvement and 21 had a pathogenic RET variant. (C) Pie charts showing the incidence of rare CNVs containing “ENS genes”, CCR “ENS genes” and coding variants in HSCR patients. (D) Graphical representation of a hypothetical model explaining the relative contributions of the risk scores in our 3 patient groups. Error bars represent standard deviation. PHENOTYPE:
|