
- Title
-
Characteristics of the New Insulin-Resistant Zebrafish Model
- Authors
- Nam, Y.H., Rodriguez, I., Shin, S.W., Shim, J.H., Kim, N.W., Kim, M.C., Jeong, S.Y., Nuankaew, W., Hong, B.N., Kim, H., Kang, T.H.
- Source
- Full text @ Pharmaceuticals (Basel)
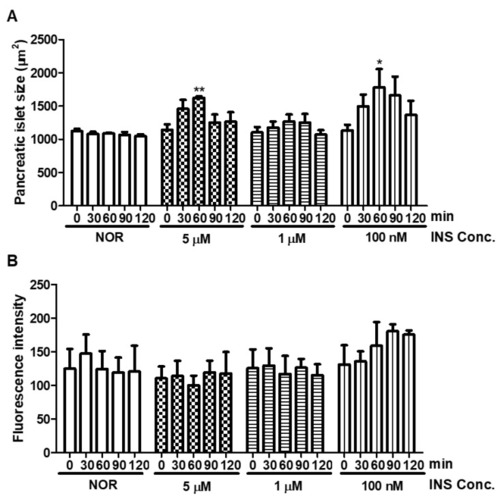
Changes in pancreatic islet following insulin (INS) treatment. (A) Dose- and time-dependent changes in pancreatic islet size caused by insulin were analyzed using Focus Lite software (n = 20). (*) p < 0.05 and (**) p < 0.01; compared to 0 min. (B) Fluorescence intensity of the pancreatic islet following insulin treatment. |

Dose- and time-dependent changes in pancreatic islet following insulin (INS) treatment. (A) Dose- and time-dependent changes in pancreatic islet size caused by insulin were analyzed using Focus Lite software (n = 20). (**) p < 0.01 and (***) p < 0.001; compared to normal group (NOR). (B) Fluorescence intensity of the pancreatic islet following insulin treatment using image J software. (***) p < 0.001; compared to NOR. (C) Fluorescent microscopic images of the pancreatic islet. The white arrow indicates the location of the pancreatic islet. Scale bar = 100 μm. |
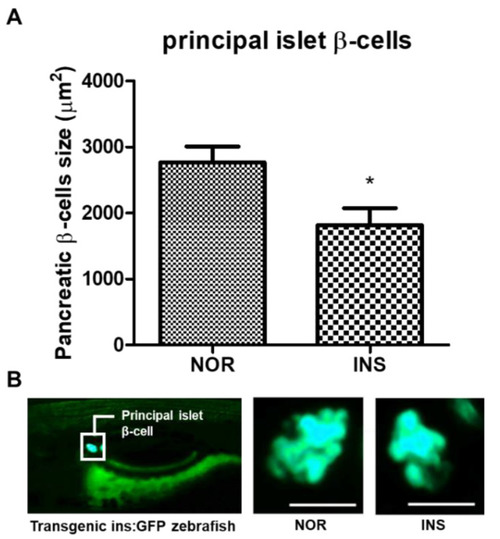
Changes in pancreatic β-cells following insulin (INS) treatment. (A) Principal islet β-cells’ size of the excess insulin-treated zebrafish (n = 20). (*) p < 0.05; compared to normal (NOR). (B) Fluorescent microscopic image of the principal islet β-cells. Scale bar = 100 μm. |
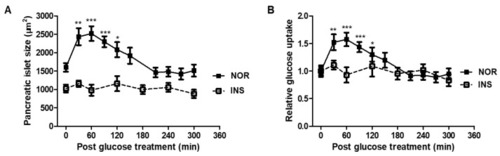
Glucose tolerance test (GTT) in insulin-treated zebrafish. (A) Size of pancreatic islet by glucose treatment (n = 20). (*) p < 0.05, (**) p < 0.01 and (***) p < 0.001; compared to 0 min. (B) Relative glucose uptake by glucose treatment (n = 20). (*) p < 0.05, (**) p < 0.01 and (***) p < 0.001; compared to 0 min. |

Insulin sensitivity test. 2-NBDG was used for measuring relative glucose uptake after treatment of 1 μM insulin for 1 h ( |
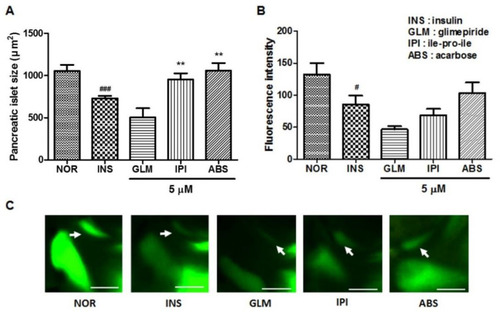
Effects of glimepiride (GLM), ile-pro-ile (IPI) and acarbose (ABS) on excess insulin-treated zebrafish. (A) Pancreatic islets’ size. (###) p < 0.001; compared to normal group (NOR). (**) p < 0.01; compared to insulin-treated group (INS). (B) Fluorescence intensity in the pancreatic islets. (#) p < 0.05; compared to NOR. (C) Representative pancreatic islet images of the NOR, INS, GLM-, IPI- and ABS-treated zebrafish. Pancreatic islets were stained using 2-NBDG. The white arrow indicates the location of the pancreatic islet. Scale bar = 100 μm. |
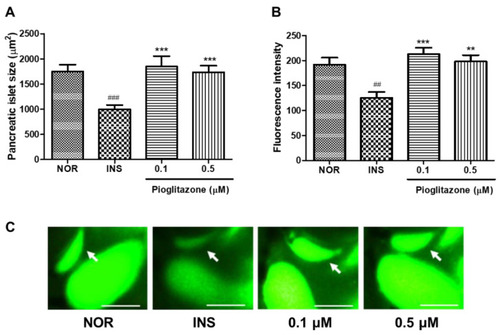
Effects of pioglitazone (PIO) on excess insulin-treated zebrafish. (A) Pancreatic islets’ size. (###) p < 0.001; compared to normal group (NOR). (***) p < 0.001; compared to insulin-treated group (INS). (B) Fluorescence intensity in the pancreatic islets. (##) p < 0.01; compared to NOR. (**) p < 0.01, (***) p < 0.001; compared to INS. (C) Representative pancreatic islet images of the NOR, INS, PIO-treated zebrafish. Pancreatic islets were stained using 2-NBDG. The white arrow indicates the location of pancreatic islet. Scale bar = 100 μm. |

Free glucose level following pioglitazone (PIO) treatment in insulin-treated zebrafish. (##) p < 0.01; compared to normal (NOR). (*) p < 0.05; compared to insulin-treated group (INS). |
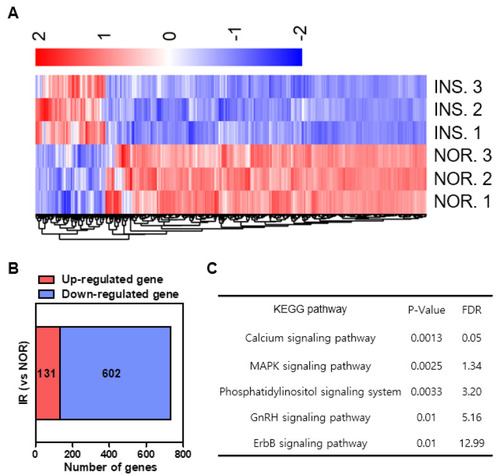
Differential gene expression induced by insulin-treated group (INS) compared to normal group (NOR). (A) Heat map based on RNA-sequencing analysis of the gene expression in zebrafish. (B) RNA-sequencing for the excess insulin treatment-regulated gene set. (C) KEGG pathways. |
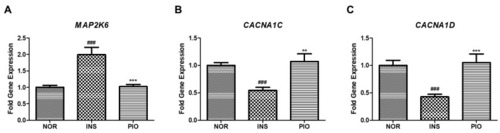
Differential gene expression induced by insulin-treated zebrafish. (A) The map2k6 gene was determined by RT-qPCR. (###) p < 0.001; compared to normal group (NOR). (***) p < 0.001; compared to insulin-treated group (INS). (B) The cacna1c gene was determined by RT-qPCR. (###) p < 0.001; compared to normal group (NOR). (**) p < 0.01; compared to insulin-treated group (INS). (C) The cacna1d gene was determined by RT-qPCR. (###) p < 0.001; compared to normal group (NOR). (***) p < 0.001; compared to insulin-treated group (INS). |