
- Title
-
Phosphorylation of H3-Thr3 by Haspin Is Required for Primary Cilia Regulation
- Authors
- Quadri, R., Sertic, S., Ghilardi, A., Rondelli, D., Gallo, G.R., Del Giacco, L., Muzi-Falconi, M.
- Source
- Full text @ Int. J. Mol. Sci.
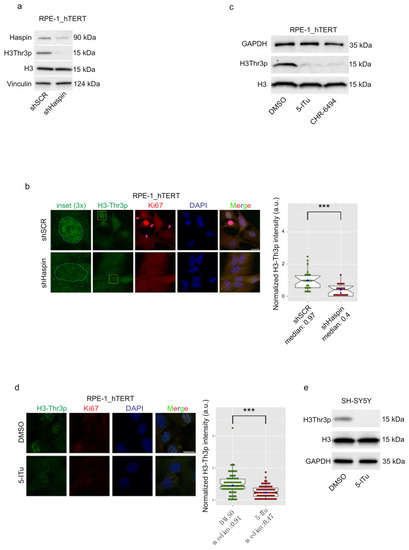
Haspin is active in G0 phase. (a) RPE-1_hTERT cells stably silenced with shSCR (control) or shHaspin were seeded and harvested after 48 h serum starvation to induce entry in G0. Silencing efficiency and H3-T3 phosphorylation were monitored by Western blotting; (b) immunofluorescence against Ki67 (proliferation marker) and H3-T3 in shSCR and shHaspin cells serum-starved for 48 h. Histone phosphorylation was quantified and is reported to the right. Silencing control is shown in Supplementary Figure S1e; (c) RPE-1_hTERT cells were seeded and serum-starved for 48 h, then treated for a further 24 h with DMSO or Haspin inhibitor 5-ITu (10 nM) and CHR-6494 (50 nM); H3T3p was monitored by Western blotting; (d) cells treated with 5-ITu were processed for immunofluorescence against Ki67 and H3-T3. Histone phosphorylation was quantified and is reported to the right; (e) Western blot analysis monitoring the levels of H3-T3p in SH-SY5Y that were differentiated into neuron-like cells, as described in Material and Methods, and then incubated for 24 h with 10 nM 5-ITu. Graphs in b, d show the median abundance of phosphorylated H3-Thr3; boxes include 50% of the data points, notch represent confidence interval (median ±1.58 IQR/sqrt(n)). t-test was applied as a statistical measurement, n.s.; not significant, *** p < 0.005. Scale bars in b, d: 20 µm. |

Loss of Haspin leads to longer and more persistent primary cilia. (a,b) shSCR and shHaspin were treated as described in Figure 1. For Haspin inhibition, entry into G0 was achieved by 48 h of serum starvation to induce ciliation. 5-ITu was added after the first 24 h of starvation. Cells were then incubated in the presence of serum to induce cell-cycle entry and cilia resorption. Samples were analyzed by immunofluorescence in G0, 2 h, and 24 h after serum readdition. Cells were fixed and processed for immunofluorescence against γ-tubulin and acetylated tubulin; representative images are shown in (a), and the percentage of cells with or without cilia is shown in (b); error bars represent standard deviation; (c) cells were processed as above to measure cilia length at the end of the incubation in serum-free medium. Representative images are shown; (d) SH-SY5Y cells were differentiated and processed by immunofluorescence to visualize basal bodies (γ-tubulin) and cilia (ARL13B). Representative images are shown; (e) RPE_1-hTERT cells were transfected with GFP or Haspin–Venus encoding plasmids and serum-starved for 48 h. At the end of the starvation, cells were fixed and processed for immunofluorescence to measure cilia length. Graphs in (c–e) show the median cilia length calculated as described in Material and Methods; boxes include 50% of the data points, notch represent confidence interval (median ± 1.58 IQR/sqrt(n)). t-test was applied as a statistical measurement, n.s.; not significant, * p < 0.05, *** p < 0.005. Scale bar in (a): 20 µm, (c,d): 5 µm. |

Loss of H3-Th3p causes an increase in cilia length. RPE-1_hTERT cells were transfected with a GFP- or Repo-Man-GFP- encoding plasmid and serum-starved for 24 h before being incubated, in serum-free media, with DMSO or 10 nM 5-iTU for a further 24 h. Cells were then fixed and processed for immunofluorescence against γ-tubulin (pink) and acetylated-tubulin (red). Representative images are shown (scale bar: 10 µm). Graph shows the median cilia length calculated as described in Material and Methods; boxes include 50% of the data points, notch represent confidence interval (median ± 1.58 IQR/sqrt(n)). t-test was applied as a statistical measurement, n.s.; not significant, *** p < 0.005. |

Displacement of Dido3 from the chromatin suppresses Haspin-dependent ciliary defects. Control or Dido3∆NT MEFs were driven in G0 by 48 h serum-starvation to induce ciliation and then treated overnight with DMSO or 10 nM 5-ITu ((a) and time 0 of (c)). At the end of the treatment, cells were incubated with a serum-containing medium to induce cilia resorption (in (c) for 2 and 24 h). Cilia length was measured by immunofluorescence analyzing acetylated tubulin and γ-tubulin (a). Representative images are shown in (a) (scale bar: 10 µm); cilia length is reported in graph (b); boxes include 50% of the data points, notch represent confidence interval (median ± 1.58 IQR/sqrt(n)). t-test was applied as a statistical measurement, n.s.; not significant, *** p < 0.005. Panel (c) shows cilia resorption kinetics represented as the normalized percentage of ciliated cells 2 h or 24 h after serum re-addition post-release. Error bars represent standard deviation. |
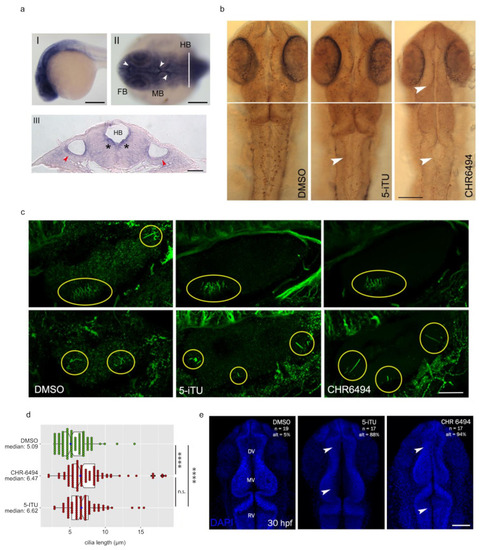
Haspin regulates cilia in the zebrafish embryo. (a-I) expression pattern of zebrafish Haspin at 24 hpf. Lateral view, anterior to the left. The gene is expressed in all brain vesicles; (a-II) dorsal view of the cephalic region, anterior to the left. The neuromeres are all heavily labeled, with a further intense signal pinpointing the whole periventricular portion of the developing brain (white arrowheads); (a-III) histological section conducted according to the plane shown in a-II (white line). The signal is clearly visible in the cells surrounding the ventricles (black asterisks) and the cells of the otic vesicle (red arrowheads). FB, forebrain; MB, midbrain; HB, hindbrain; (b) embryos were treated with either DMSO, 5-ITU, or CHR-6494 until 48 hpf, when they were processed for immunohistochemistry with a phosphorylated H3-T3 antibody. Dorsal views are shown; white arrowheads indicate points of reduced histone phosphorylation; (c,d) embryos were incubated with DMSO or Haspin inhibitors for 72 h when they were fixed and processed for immunofluorescence against acetylated tubulin. Yellow circles indicate ciliated regions, two different z stacks for each sample are shown; cilia length was measured and is reported in d; boxes include 50% of the data points, notch represent confidence interval (median ± 1.58 IQR/sqrt(n)). t-test was applied as a statistical measurement, n.s.; not significant, * p < 0.05, **** p < 0.001; (e) embryos were treated with DMSO or Haspin inhibitors for 30 h and then stained with DAPI to monitor neural tube morphology. Scale bars: (a-I) 200 µm; (a-II) 50 µm; (a-III) 10 µm; (b) 100 µm; (c) 25 µm; (e) 100 µm. EXPRESSION / LABELING:
PHENOTYPE:
|

ZFIN is incorporating published figure images and captions as part of an ongoing project. Figures from some publications have not yet been curated, or are not available for display because of copyright restrictions. EXPRESSION / LABELING:
|