FIGURE SUMMARY
Title

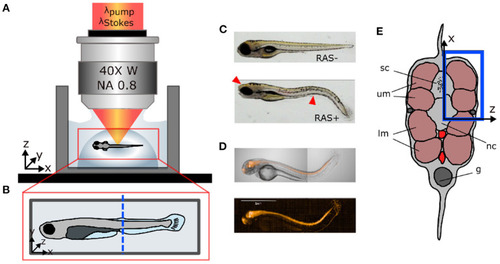
Toward Quantitative in vivo Label-Free Tracking of Lipid Distribution in a Zebrafish Cancer Model

Authors
Andreana, M., Sturtzel, C., Spielvogel, C.P., Papp, L., Leitgeb, R., Drexler, W., Distel, M., Unterhuber, A.
Source
Full text @ Front Cell Dev Biol

Sample preparation for in vivo imaging. (A) Lateral view of coherent anti-Stokes Raman scattering (CARS) microscope objective showing the fish mounted in agarose gel. (B) Top view of fish mount showing the imaging region of interest (ROI) (blue dashed line). (C) Microscopic white light images of RAS- and RAS+ larvae showing the cancer phenotype (red arrows). (D) mCherry expression at location of RasG12V expression in a 96 hpf larvae. (E) Cross-section of the zebrafish larvae showing the ROI in depth (blue rectangle) with: sc, spinal cord; um, dorsal myotomes; lm, lower myotomes; nc, notochord; g, gut.

In vivo hyperspectral coherent anti-Stokes Raman scattering (CARS) images. (A) CARS image of healthy zebrafish larva at 120 hpf at 2,845 cm−1, field of view (FOV) is 80 × 80 μm2. (B) High-resolution CARS image of the green dashed square in (A) showing contrast coming from the lipid content of the muscle cells, FOV is 30 × 30 μm2. (C) Quadratic power dependency of the CARS signal of the white dashed rectangle area in (A) respect to the pump power intensity. R-squared of the quadratic fit is 0.9889. (D) Spectral information provided by hyperspectral CARS allowing discrimination between the resonant signal of lipids and 1% agarose gel.

In vivo coherent anti-Stokes Raman scattering (CARS) images at 2,845 cm−1 at three different depths for RAS- (left) and RAS+ (right) larvae. nc, notochord; um, dorsal myotome region. All images have a FOV of 100 × 100 μm2.

In vivo confocal images of Nile Red stained RAS- (A) and RAS+ (B) 120 hpf larvae imaged with 25x, 0.95 NA water immersion objective. The contrast is based on fluorescence of Nile Red excited with 510 nm laser excitation showing lipid (triglycerides) distribution and content. All images have a field of view (FOV) of 100 × 100 μm2.

PHENOTYPE:
Fish:
Observed In:
Stage: Day 5

Longitudinal in vivo coherent anti-Stokes Raman scattering (CARS) images at 2,845 cm−1 for RAS- and RAS+ larvae from 72 to 120 hpf (left and right columns). All images have a field of view (FOV) of 100 × 100 μm2. The single image contrast is optimized for better visualization. Center column shows the lipid distribution on the specific region of interest (ROI). Significant differences between the 3 groups with n = 3 (72, 96, and 120 hpf) are shown (*p < 0.02, **p < 0.03, and ***p < 0.04).

Acknowledgments
This image is the copyrighted work of the attributed author or publisher, and ZFIN has permission only to display this image to its users. Additional permissions should be obtained from the applicable author or publisher of the image. Full text @ Front Cell Dev Biol