The protective effect of nine samples of GF (S1-S9) collected from different areas on liver injury and inflammation (A) Phenotypic micrograph of the transgenic zebrafish with fluorescence label in the liver (B) Statistical results of the fluorescence intensity of the liver in zebrafish until five dpf in all groups. n = 10 (C) Distribution phenotypic micrograph of neutrophils (white arrows) in zebrafish and enlarged drawing of neutrophils spreading to the lateral neuromast of the tail (D) Statistical results of the number of neutrophils diffusion in zebrafish in all groups, n = 10.

Comparison of the protective effects of GF (S7 and S8) collected from specific locations on liver injury (A) Phenotypic micrograph of the transgenic zebrafish with fluorescence label in the liver (B) Comparative analysis of protective effects of S7 and S8 with different doses on liver injury (C) Comparison of multiple batches of protective effects of GF from two areas, Fuding and Jiujiang, on the liver. n = 10.

Comparison of the anti-inflammatory activities of GF (S4 and S6) collected from specific locations (A) Distribution phenotypic micrograph of neutrophils in zebrafish and enlarged drawing of neutrophils spreading to the lateral neuromast of the tail. at ×32 magnification (B) Comparative analysis of the effects of inflammation inhibition in zebrafish treated with S4 and S6 of different concentrations (C) Multiple batches’ comparison of anti-inflammatory effects of GF from two locations: Panan and Jichun. n = 10.

The results of multivariate statistical analysis of metabolomic data of protective effects of GF on liver injury and inflammation (A) A PCA scatter plot of 10 GF samples (B) The OPLA-DA scatter plot of the 10 samples (C) The S-plots for the OPLA-DA in the experiments of liver protection (D) PT test of the OPLA-DA model in experiments of liver protection (E) The PCA scatter plot of 11 GF samples (F) The OPLA-DA scatter plot of 11 samples (G) S-plots for the OPLA-DA in anti-inflammatory experiments (H) PT test of the OPLA-DA model in anti-inflammatory experiments.

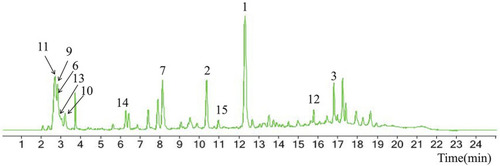
TICs of GF compounds at a negative ion mode. The total ion chrtograms (TICs) of GF extract, 1, 2, three on behalf of geniposide, genipin-1-β-D-gentiobioside, crocin-1, respectively; 6,7 and 9–15 represent quinic acid, gardenoside, d-glucuronic acid, l-malic acid, mannitol, rutin, d-glucaric acid, shanzhiside, chlorogenic acid, and genipin-1-β-D-gentioside, respectively.

Confirmation of the protective effects of the identified bioactive compounds of GF on liver injury and inflammation (A) Quantified statistical results of protective effects of geniposide, genipin-1- β-D-gentiobioside, and crocin-1 with different doses on liver injury. n = 10 (B) Quantified statistical results of anti-inflammatory effects of quinic acid, gardenoside, d-glucuronic acid, l-malic acid, mannitol, rutin, chlorogenic acid, shanzhiside, d-glucaric acid, and genipin-1-β-D-gentioside with different doses. n = 10.

Acknowledgments
This image is the copyrighted work of the attributed author or publisher, and ZFIN has permission only to display this image to its users. Additional permissions should be obtained from the applicable author or publisher of the image. Full text @ Front Pharmacol