
- Title
-
Label-free photoacoustic microscopy: a potential tool for the live imaging of blood disorders in zebrafish
- Authors
- Yang, W., Wang, W., Jing, L., Chen, S.L.
- Source
- Full text @ Biomed. Opt. Express
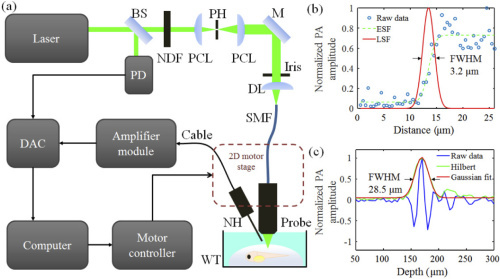
(a) The schematic of PAM imaging setup. BS, beamsplitter; PD, photodiode; NDF, neutral density filter; PCL, plano-convex lens; PH, pinhole; M, mirror; DL, doublet lens; SMF, single-mode fiber; NH, needle hydrophone; WT, water tank; DAC, data acquisition card. (b) Measured lateral resolution of 3.2 µm. (c) Measured axial resolution of 28.5 µm. |
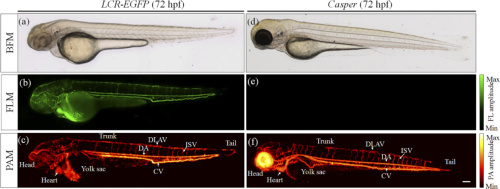
(a)−(c) Imaging of the same 72 hpf transgenic Tg (LCR-EGFP) zebrafish embryo (with PTU treatment): BFM image (a), FLM image (b), and PAM image (c). (d)−(f) Imaging of the same 72 hpf casper zebrafish embryo: BFM image (d), FLM image (e), and PAM image (f). Scale bar: 100 µm. All images share the same scale bar. |
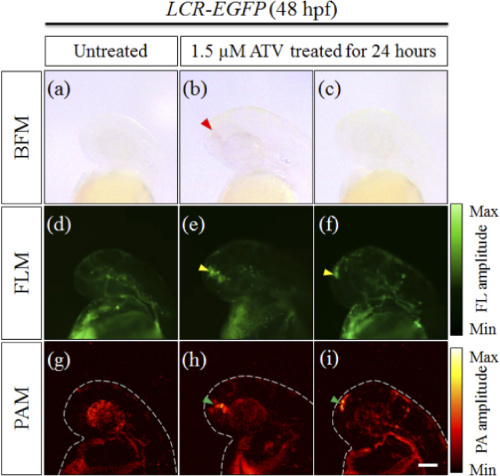
Imaging of the transgenic Tg (LCR-EGFP) zebrafish embryos without and with ATV treatment (ICH model): representative images. (a)−(c) BFM images. (d)−(f) FLM images. (g)−(i) PAM images. For each column, the same region of the same zebrafish sample was imaged. The identified ICH regions are marked by the triangles. Scale bar: 100 µm. All images share the same scale bar. |

Imaging of the transgenic Tg (LCR-EGFP) zebrafish embryos without and with PHZ treatment (HA model): representative images. (a,b) BFM images. (c,d) FLM images. (e,f) PAM images. For each column, the same region of the same zebrafish sample was imaged. Scale bar: 100 µm. All images share the same scale bar. |
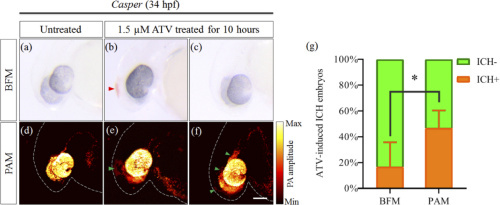
Imaging of the casper zebrafish embryos without and with ATV treatment (ICH model): representative images and statistical study. (a)−(c) BFM images. (d)−(f) PAM images. For each column, the same region of the same zebrafish sample was imaged. The identified ICH regions are marked by the triangles. Scale bar: 100 µm. All images share the same scale bar. (g) Statistical study results for ICH identification. SD is denoted by the error bars. *P = 0.0267 (by Tukey's test). |
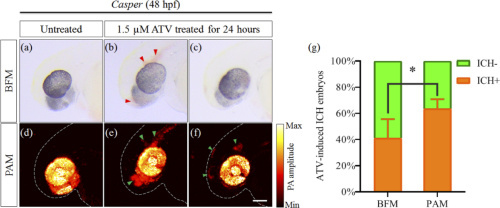
Imaging of the casper zebrafish embryos without and with ATV treatment (ICH model): representative images and statistical study. (a)−(c) BFM images. (d)−(f) PAM images. For each column, the same region of the same zebrafish sample was imaged. The identified ICH regions are marked by the triangles. Scale bar: 100 µm. All images share the same scale bar. (g) Statistical study results for ICH identification. SD is denoted by the error bars. *P = 0.0339 (by Tukey's test). |
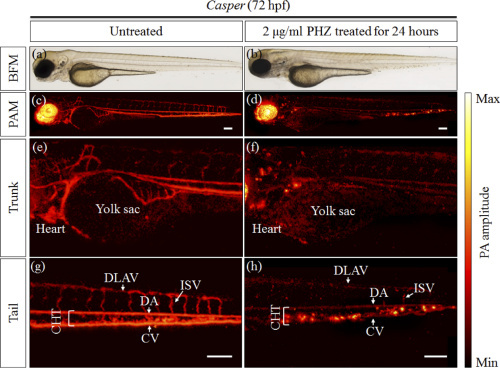
Imaging of the casper zebrafish embryos without and with PHZ treatment (HA model). (a,b) BFM images. (c,d) PAM images. (e,f) Zoom PAM images of the trunk. (g,h) Zoom PAM images of the tail. For each column in BFM and PAM images ((a)−(d) only), the same region of the same zebrafish sample was imaged. Scale bars: 100 µm. (e) and (g) share the same scale bar in (g). (f) and (h) share the same scale bar in (h). |