
- Title
-
Zebrafish behavior feature recognition using three-dimensional tracking and machine learning
- Authors
- Yang, P., Takahashi, H., Murase, M., Itoh, M.
- Source
- Full text @ Sci. Rep.

Flowchart illustrating the experimental strategy of this study. The experimental workflow included recorded novel tank test behaviors across treatments and trials. A video-tracking analysis was performed and 3D swimming path reconstruction was performed by using customized MATLAB and R software. Time-segmentation and dimensionality reduction of the 3D spatiotemporal data were performed by a principal component analysis (PCA), followed by unsupervised clustering by using customized machine learning algorithms (FuzzyART) across all behavioral spatiotemporal data to identify potential behavior features linked to treatment. Finally, a behavior feature evaluation was performed with the trained model and new input data. |

Schematics of the setup to acquire 3D trajectories in response to the experimental stimuli. ( source microcontroller)-based programmed electric stimulus system and a two-camera video capture system. Naive wild-type zebrafish were placed in an unfamiliar novel tank. Animal behavior was manually observed, and two cameras recorded videos for automated analysis in EthoVision XT10. Tracking data for each subject were exported, processed and visualized by customized MATLAB and R software programs. ( |

Camera time synchronization and swim path reconstructions in adult zebrafish. (A) Animal behavior was manually observed, two cameras recorded the videos, and the time lag between two videos (ventral and lateral) was synchronized by an LED indicator. At the beginning of the experiment, the LED indicator was automatically turned on by Arduino. The experiment’s beginning frame of each video was detected via a computer vision analysis by a customized MATLAB program to ensure the accuracy of behavioral spatiotemporal data. (B) After time synchronization, 3D swimming path reconstruction was performed using a customized R program. |
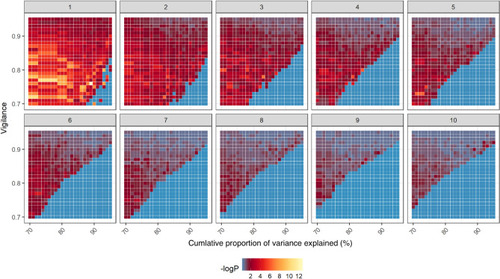
Clustering showed that a higher –log10 (p)) value will lead to ES-specific behavior. For the different time segment behaviors (1 ~ 10 s, figure panel label), the correlation between the cluster and treatment was shown in each tile under different clustering analysis conditions. A binomial test was performed to examine whether the behavior feature was significantly biased toward the treatment (ES). The legend is shown below the heatmap, with the minimal -log10 (p) of the binomial test of the top ES-specific behavior feature on that clustering analysis condition shown in dark blue and high –log10(p) shown in yellow. |

Behavioral features identified by machine learning. ( |
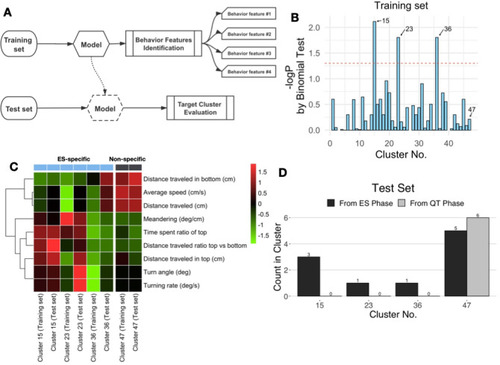
Behavioral features identified by machine learning. (A) Correlations between the cluster of behavior features and treatment of the optimal parameter values found by grid search (shown in Fig. 4) in 5 s time segment behavior. Cluster no. 45 was significantly associated with treatment (ES phase); cluster no. 48 was significantly associated with no treatment (QT phase). The cluster identifier number is shown on the x-axis, and -log p-values are indicated on the y-axis. The horizontal red dashed line shows a p-value of 0.05 by binomial test (the probability of correlation was not significantly different from 0.5 for each of the clusters). (B) Exploratory behavioral profiles of zebrafish between cluster no. 45 (ES phase) and cluster no. 48 (QT phase), which were newly identified by the clustering analysis. (C) Reconstruction and visualization of the 3D swim path of adult zebrafish between cluster no. 45 (ES phase) and cluster no. 48 (QT phase). Because of the limitation of the picture size, only 9 motion tracks in each behavior feature are displayed. Data are shown as the mean ± SEM for zebrafish (n = 10, Student's t-test), with p < 0.05 and p < 0.01 represented by * and **, respectively. |