
- Title
-
The Ameliorative Effects of Isorhynchophylline on Morphine Dependence Are Mediated Through the Microbiota-Gut-Brain Axis
- Authors
- Chen, Z., Zhijie, C., Yuting, Z., Chan, L., Shilin, X., Qichun, Z., Jinying, O., Jing, L., Chaohua, L., Zhixian, M.
- Source
- Full text @ Front Pharmacol

Cells were subjected to immunofluorescence analysis using an antibody directed against AIF1 (green). Nuclei were counterstained with DAPI (blue). The fluorescence was visualized and imaged under a fluorescence microscope. C: control group; M: morphine group; M + M: morphine+methadone group; M + I: morphine+isorhynchophylline; M + MH: morphine+minocycline hydrochloride. |
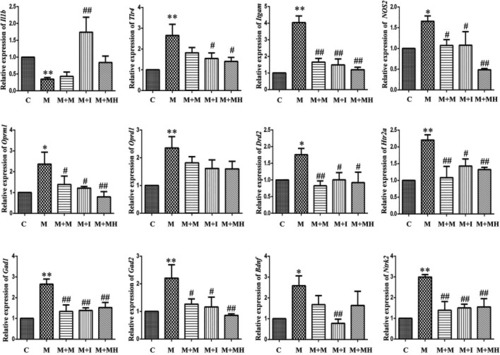
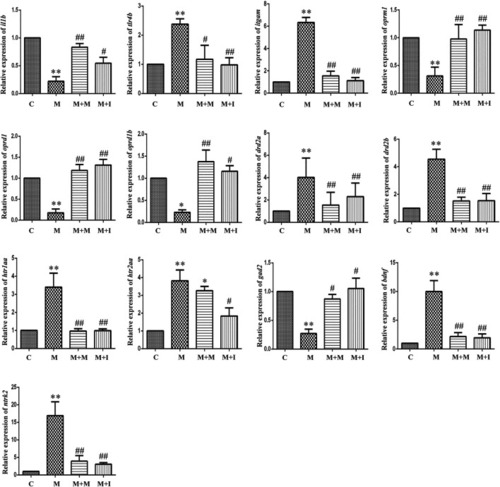
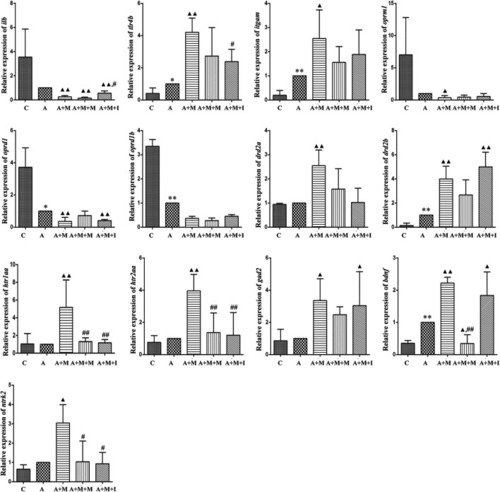
qPCR analysis of Il1b, Tlr4, Itgam, Nos2, Oprm1, Oprd1, Drd2, Htr2a, Gad1, Gad2, Bdnf, and Ntrk2 expression in BV2 cells (n = 3). *p < 0.05, **p < 0.01 vs the C group; #p < 0.05, ##p < 0.01 vs the M group. C: control group; M: morphine group; M + M: morphine + methadone group; M + I: morphine + isorhynchophylline group; M + MH: morphine + minocycline hydrochloride group. |

Isorhynchophylline can inhibit morphine-induced CPP responses. |
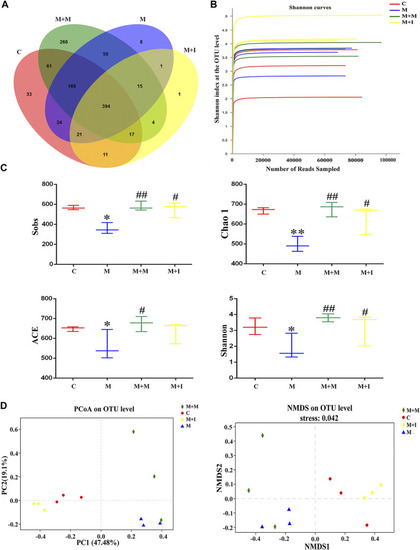
Comparison of community structure among the fecal microbiota of the C, M, M + M, and M + I groups. |
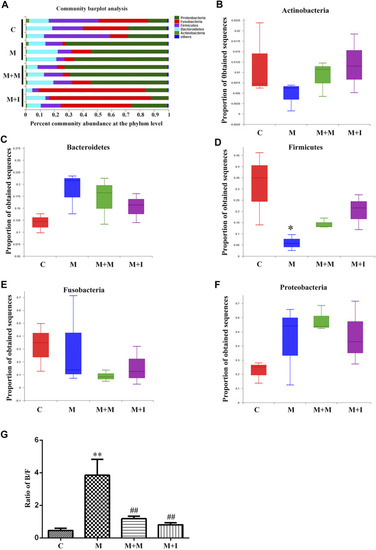
Comparison of species composition among the fecal microbiota of the C, M, M + M, and M + I groups at the phylum level. |
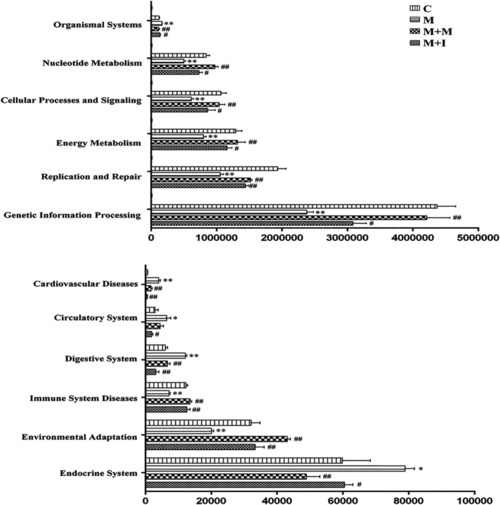
Differentially regulated functional pathways based on KEGG enrichment analysis inferred from 16S rRNA gene sequences using PICRUSt. * |
qPCR analysis of |
qPCR analysis of |
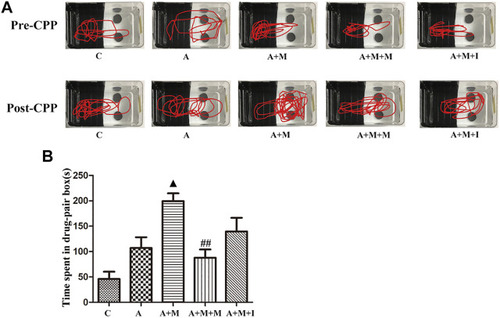
Isorhynchophylline cannot improve morphine-induced CPP responses following antibiotic treatment. |
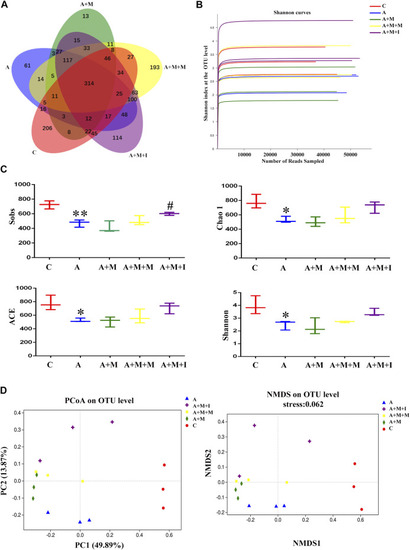
Comparison of community structure among the fecal microbiota of the C, A, A + M, A + M + M, and A + M + I groups. |

Comparison of species composition among the fecal microbiota of the C, A, A + M, A + M + M, and A + M + I groups at the phylum level. |
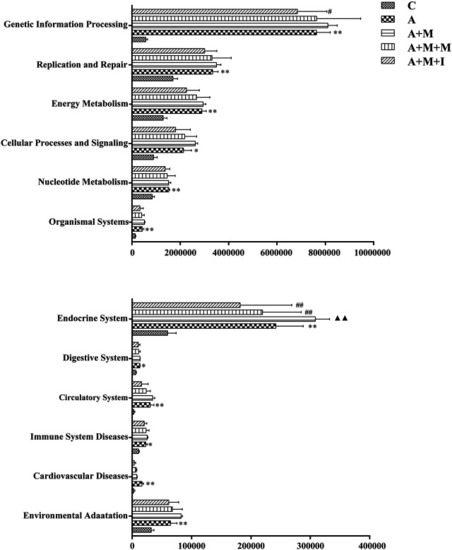
Differentially regulated functional pathways based on KEGG enrichment analysis inferred from 16S rRNA gene sequencing using PICRUSt. * |
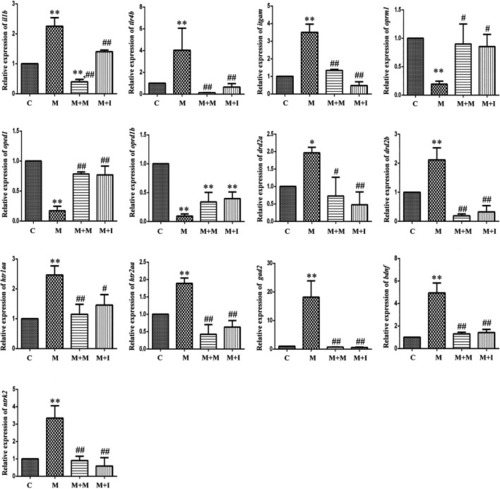
qPCR analysis of |
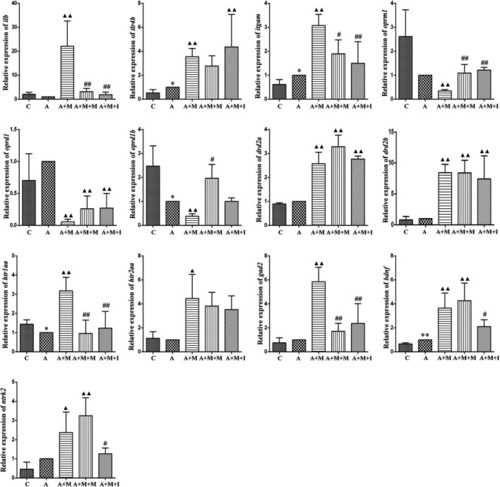
qPCR analysis of |
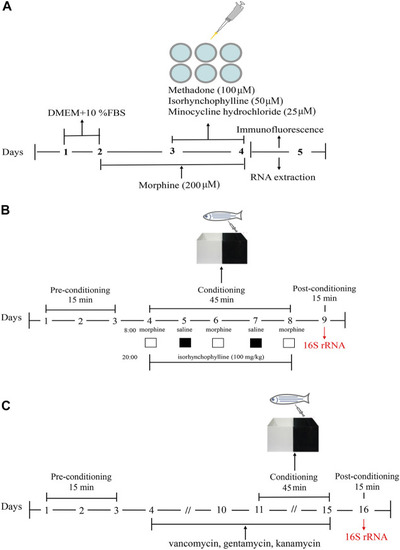
Schematic of the experimental design. |