FIGURE SUMMARY
Title

Stromal interaction molecule 1 (STIM1) knock down attenuates invasion and proliferation and enhances the expression of thyroid-specific proteins in human follicular thyroid cancer cells

Authors
Asghar, M.Y., Lassila, T., Paatero, I., Nguyen, V.D., Kronqvist, P., Zhang, J., Slita, A., Löf, C., Zhou, Y., Rosenholm, J., Törnquist, K.
Source
Full text @ Cell. Mol. Life Sci.

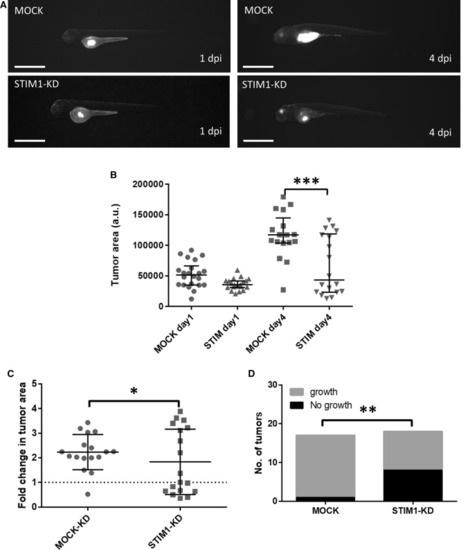
Zebrafish xenograft experiments. A Representative images of one and four day (s) post injection (dpi) with MOCK and STIM1-KD cells and the increase in tumor growth. The scale bar is 1 mm. B, C Quantitation of tumor size and fold change tumor area. D Quantitation of tumor growth. *p < 0.05; **p < 0.01; ***p < 0.001

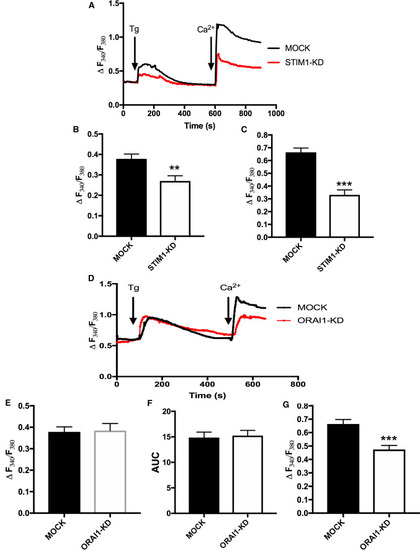
Expression of STIM1 and ORAI1 proteins and generation of stable knock-down cells. A Expression profile of STIM1 and ORAI1 proteins in primary thyroid and aggressive thyroid cancer cell lines by western blotting. The bars show the mean ± SEM (n = 3, *P < 0.05, **P < 0.01; ***P < 0.001). B-E, expression of STIM1 or ORAI1 in shRNA expressing (MOCK) and shRNA STIM1 expressing (STIM1-KD) or shRNA ORAI1 expressing (ORAI1-KD) cells on mRNA and protein levels by RT-PCR and Western blotting, respectively. The bars show the mean ± S.E. (n = 3). ***p < 0.001

A Representative traces showing Thapsigargin-evoked (Tg, final concentration, 1 μM) changes in [Ca2+]i in MOCK and STIM1-KD cells in calcium-free buffer and the effect of re-addition of 1 mM calcium (final concentration).B Bar diagram showing the magnitude of the Tg-evoked peak in [Ca2+]i. The bars show the mean ± S.E. of at least 40 cells. p < 0.01. C Bar diagram showing the magnitude of the change in [Ca2+]i after re-addition of calcium (final concentration, 1 mM) to Tg-treated cells. The bars show the mean ± S.E. of at least 40 cells. ***p < 0.001. D Representative traces showing Tg-evoked (final concentration, 1 μM) changes in [Ca2+]i in MOCK and ORAI1-KD cells in calcium-free buffer and the effect of readdition of 1 mM calcium. E Bar diagram showing the magnitude of the Tg-evoked peak in [Ca2+]i. The bars show the mean ± S.E. of at least 40 cells. F Bar diagram showing the area under the Tg curve (time, 60–480 s). The bars show the mean ± S.E. of at least 40 cells. G Bar diagram showing the magnitude of the change in [Ca2+]i after readdition of calcium (final concentration, 1 mM) to Tg-treated cells. The bars show the mean ± S.E. of at least 40 cells. ***p < 0.001

STIM1 or ORAI1 knock-down attenuates invasion and receptor expression in thyroid cancer ML-1 cells. A, D, STIM1 or ORAI1 knock-down both decreased the basal and abolished the S1P-evoked (final concentration, 100 nm) invasion in ML-1 cells. The bars show the mean ± S.E. (n = 4). *Denotes comparison with MOCK cells. ***p < 0.001. B STIM1 knock-down decreased the relative expression of S1P3. A representative Western blot is shown. The bar diagram shows the decreased expression of S1P3 in STIM1-KD cells compared with MOCK cells (mean ± S.E., n = 3) ***p < 0.001. C STIM1 knock-down decreased the relative expression of VEGFR2. A representative Western blot is shown. The bar diagram shows the decreased expression of VEGFR2 in STIM1-KD cells compared with MOCK cells (mean ± S.E., n = 3). ***p < 0.001. E ORAI1 knock-down decreased the relative expression of S1P1. A representative Western blot is shown. The bar diagram shows the decreased expression of S1P1 in ORAI1-KD cells compared with MOCK cells (mean ± S.E., n = 3). ***p < 0.001. F ORAI1 knock-down decreased the relative expression of VEGFR2. A representative Western blot is shown. The bar diagram shows the decreased expression of VEGFR2 in STIM1-KD cells compared with MOCK cells (mean ± S.E., n = 3). ***p < 0.001

STIM1 and ORAI1 regulate proliferation of thyroid cancer ML-1 cells. A STIM1 and ORAI1 knock-down decreased proliferation after 48 h. The bar diagram shows the mean ± S.E. (n = 3). ***p < 0.001. B, C STIM1 and ORAI1 knock-down decreased proliferation by prolonging the G1 phase and decreasing the S phases of the cell cycle. ***p < 0.001. *Statistically significant differences between the G1 and S phases of cell cycle, respectively, in STIM1-KD and ORAI1-KD cells compared with the MOCK cells. D, Representative Western blots showing the upregulation of p21 and p27 in both STIM1 and ORAI1-KD cells. E Representative Western blot showing the downregulation of cyclin-dependent kinase 6 (cdk6) in both STIM1 and ORAI1-KD cells. FH Cells were treated with indicated concentrations of Lenvatinib, Paclitaxel or Doxorubicin and the proliferation was assessed by MTT proliferation assays (24 h. The effects of tested drugs were significant (p < 0.001) in STIM1-KD compared with MOCK cells. Each data point represents the mean ± S.E. of at least three independent experiments

STIM1 knock-down decreased the expression of HIF-1α, calpain activity and the activity of MMP2 and MMP9 and in ML-1 cells. A The expression of HIF-1α was significantly decreased in STIM1-KD cells compared with MOCK cells. A representative Western blot is shown. B the expression of EMT marker proteins in STIM1-KD cells compared to the MOCK ML-1 cells. The representative Western blots are shown. C the expression of total-ERK and phospho-ERK in STIM1-KD cells compared with MOCK ML-1 cells. The representative Western blots are shown. D STIM1 knock-down decreased the basal and abolished the S1P-evoked increase in calpain activity compared to MOCK ML-1 cells. (N = 4), *Denotes comparison with MOCK. *p < 0.05, **p < 0.01. E The basal and S1P evoked gelatinolytic activity of MMP2 and MMP9 was decreased in STIM1-KD cells, compared with MOCK ML-1 cells. The representative zymography blot is shown. F STIM1 knock-down increased the expression of thyroid-specific proteins. The representative Western blots of at least three independent experiments are shown. G STIM1 knock-down enhanced the basal and TSH-evoked iodine-uptake compared to in the MOCK cells. *Denotes comparison with MOCK cells; o, denotes comparison with control STIM1-KD cells. (n = 4) *p < 0.05, ***p < 0.001, oop < 0.01

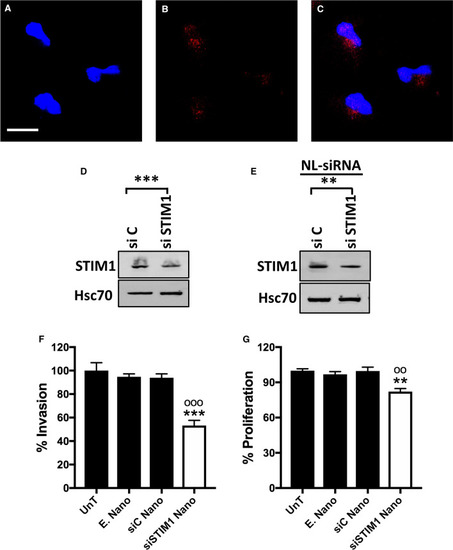
Functional efficacy of MPDA-DMEA nanoparticles in ML-1 thyroid cancer cells. AC Confocal images of ML-1 cells with control siRNA-Alexa Fluor 555 loaded nanoparticles. A (DAPI), B (siRNA-Alexa Fluor 555), and C (Merge: DAPI + siRNA-Alexa Fluor 555). The scale bar is 20 μm. The images shown are representative of at least three separate experiments. D Representative western blot showing the efficacy of siSTIM1 in ML-1 cells. E Representative western blot showing the efficacy of siSTIM1-loaded MPDA-DMEA nanoparticles in ML-1 cells. NL-siRNA denotes nanoparticles loaded siRNA. F, G siSTIM1-loaded nanoparticles decreased the invasion and proliferation of ML-1 cells. UnT, un-treated; E.Nano, empty MPDA-DMEA nanoparticles, siC Nano, control non-target siRNA loaded nanoparticles, siSTIM1 Nano, siSTIM1 loaded nanoparticles. *ML-1 unT vs siSTIM1 Nano, osiC Nano vs siSTIM1 Nano. The bars show the mean ± S.E. (n = 6). **p < 0.01; ***p < 0.001; oop < 0.01; ooop < 0.001

STIM1-protein expression in human normal and thyroid cancer tissues. A, B Representative images of normal and papillary thyroid cancer. C, D Representative images of normal and follicular thyroid cancer tissue. E, F Representative images of normal and anaplastic thyroid cancer tissue. The representative images of control and cancer tissue sections of each cancer type are from the same patient. G Representative image of normal thyroid tissue from a healthy subject. Scale bar 50 µM. The final images were acquired at 20× magnification using case viewer software (3DHITECH Ltd, Germany). H Heatmap to visualize differential expression of STIM1 and ORAI1 between thyroid tumors and their adjacent normal samples. The color intensity represents log2 Fold Changes. Significances have been corrected by Benjamini–Hochberg method. *p < 0.05; **p < 0.01; ***p < 0 .001. I STIM1 expression comparison between thyroid cancer tissues, their para-cancerous tissues, and normal controls. Data were presented as mean ± SE. One-way ANOVA test was used to assess statistical significance. ***p < 0 001. J STIM1 and ORAI1 expression comparison between papillary thyroid cancer tissues and follicular thyroid cancer tissues. Data were presented as mean ± SE. Unpaired t test was used to assess statistical significance. **p < 0.01.

Acknowledgments
This image is the copyrighted work of the attributed author or publisher, and ZFIN has permission only to display this image to its users. Additional permissions should be obtained from the applicable author or publisher of the image. Full text @ Cell. Mol. Life Sci.