
- Title
-
Microtubule organization of vertebrate sensory neurons in vivo
- Authors
- Shorey, M., Rao, K., Stone, M.C., Mattie, F.J., Sagasti, A., Rolls, M.M.
- Source
- Full text @ Dev. Biol.

Fig. 1. Zebrafish RB neurons have uniform plus-end-out microtubule polarity. A. Schematic illustration of zebrafish egg injection. B. Maximum projection of a time-series image of a 1dpf zebrafish RB neuron expressing EB3-GFP controlled by Isl1[ss]. C. Maximum projection of a time-series image of a 4dpf zebrafish RB neuron expressing EB3-GFP D. Graph displaying quantification of comet direction in the central and peripheral neurites of RB neurons at timepoints from 1dpf to 4dpf; number on column is the number of comets counted for that condition. E. Sample kymographs of RB neurons expressing EB3-GFP at 1 and 4dpf. |

Fig. 2. Zebrafish RB neuron microtubules remain plus-end-out for the life of the cell. A. Overview of 3dpf zebrafish embryo bearing transgenic insertions of P2rx3a > EB3-GFP, P2rx3a > mCherry and Isl1[ss]>tdTomato showing the location and abundance of RB neurons at 3dpf. Enlarged image shows exit of neurites from the cell bodies in the spinal cord. B. Higher magnification image showing the morphology of RB neuron sensory endings. Transgenes are not expressed uniformly in all neurons so some cells are labeled red, others green and some both. C. A representative kymograph generated from RB sensory endings is shown. D. Overview of the posterior portion of a 21dpf zebrafish showing the position of DRG neuron cell bodies, the morphology of the peripheral nerves and the strong reduction in visible RB neurons relative to 3dpf. E. higher magnification region showing a rare visible RB neuron in a 21dpf zebrafish. F. image of a quantified portion (blue box) of RB sensory neurite in a 21dpf zebrafish. G. Sample kymograph of RB sensory neurite in a 21dpf zebrafish neuron expressing EB3-GFP H. Graph showing quantification of comet direction in 3dpf and 21dpf RB sensory neurites expressing EB3-GFP; number on column is the number of comets counted for that condition. |

Fig. 3. Most zebrafish DRG neurons retain bipolar morphology throughout development. A. Brightfield overview of 5 week old casper zebrafish. B. Confocal image of the posterior region of the zebrafish spine showing the spinal cord, DRG neurons and their nerves. C. higher magnification image showing DRG neurons cell bodies and their centrally and peripherally projecting neurites. D. Airyscan super-resolution images of DRG neurons expressing EB3-GFP, showing clear centrally and peripherally projecting neurites originating from separate locations on the cell body marked pink and blue respectively. Asterisk indicates rare neuron with a cell body projection from which both neurites emerge. E.F. Representative kymographs from the centrally and peripherally projecting neurites respectively of 5-week-old zebrafish DRG neurons expressing EB3-GFP G. Brightfield overview of 3 month old zebrafish. H. 2 photon image of the posterior DRG cluster of a 3 month old zebrafish expressing EB3-GFP I. Higher magnification image of a DRG neuron at the edge of the cluster. Central and peripheral neurites are indicated with pink and blue lines respectively. |
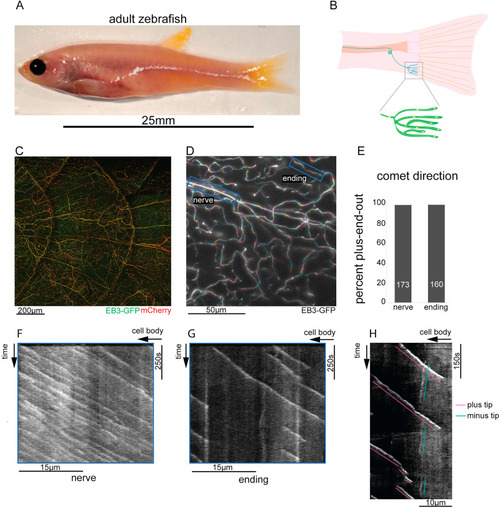
Fig. 4. Zebrafish DRG sensory endings have uniform plus-end-out microtubule polarity throughout their entire arbor. A. Brightfield overview of an 8-10 month-old adult zebrafish. B. Diagram of a single DRG sensory neuron innervating a posterior scale. C. Confocal z-stack of a scale innervated by DRG sensory neurons expressing mCherry and EB3-GFP D. False-colored time series z-stack image of the surface of a scale on an 8-10 month-old zebrafish expressing EB3-GFP with successive timepoints batched into colors progressing from the blue to red end of the spectrum, showing a series of rainbows with their red end oriented towards the end of the neurite, reflecting a plus end out microtubule polarity. E. Quantification of microtubule polarity from movies of EB3-GFP in DRG nerves and endings in 8–10 month-old zebrafish; number on column is the number of comets counted for that condition F.G. Representative kymographs of EB3-GFP in the nerve and sensory endings respectively. H. Kymograph generated from a movie of EB3-GFP in a sensory ending in which both growing minus ends (blue) and plus ends (pink) are visible. |

Fig. 5. Zebrafish sensory neurons maintain a somatic hotspot of microtubule organization. A. Brightfield image of a 3rd instar drosophila larva and image of a ddaE neuron cell body expressing EB1-GFP and fzr-RFP are shown. The blue line indicates the region used to quantify EB1-GFP intensity from a sum projection of a timeseries. The output for fzr-RFP (red) and EB1-GFP (green) is shown in the graph. B. A brightfield image of a 4–6 tentacle stage Nematostella vectensis polyp and an image of a tripolar ganglion cell expressing EB1-GFP are shown. The blue line was used as the region for summing intensity through the time course and the output is shown in the graph. C. A brightfield image of a 14dpf zebrafish and images of DRG neuron cell bodies expressing EB3-GFP are shown together with lines used to quantify EB3-GFP fluorescence. The graphs show intensity along the line summed through the timecourse. D.-G. Brightfield overviews and images of RB neuron cell bodies expressing EB3-GFP are shown from different age fish. In each a line was used to generate summed intensity graphs. |
Reprinted from Developmental Biology, 478, Shorey, M., Rao, K., Stone, M.C., Mattie, F.J., Sagasti, A., Rolls, M.M., Microtubule organization of vertebrate sensory neurons in vivo, 1-12, Copyright (2021) with permission from Elsevier. Full text @ Dev. Biol.