FIGURE SUMMARY
Title

VEGFC/FLT4-induced cell-cycle arrest mediates sprouting and differentiation of venous and lymphatic endothelial cells

Authors
Jerafi-Vider, A., Bassi, I., Moshe, N., Tevet, Y., Hen, G., Splittstoesser, D., Shin, M., Lawson, N.D., Yaniv, K.
Source
Full text @ Cell Rep.

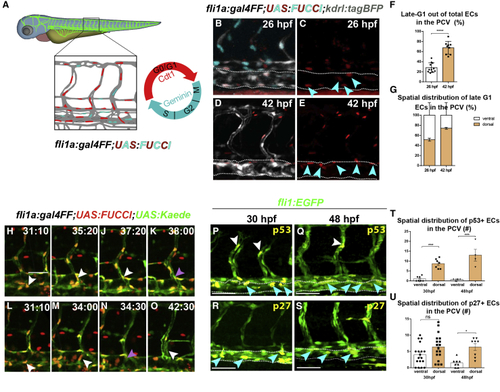
Endothelial cells sprout from the PCV in G1 phase

(A) Schematic representation of cell cycle stages in ECs as highlighted by the Tg(fli1a:Gal4FF;UAS:FUCCI) reporter.

(B–E) Selected confocal snapshots from a time-lapse series of a Tg(fli1a:Gal4FF;UAS:FUCCI;kdrl:tagBFP) embryo depicting the distribution of late G1 (red) ECs in the PCV (outlined by dashed lines) at 26 (B and C, light-blue arrowheads) and 42 (D and E, light-blue arrowheads) hpf.

(F) Fraction of late-G1 ECs out of total PCV cells (n26 hpfembryos = 11; n42hpf embryos =9 ). Data show mean ± SEM (unpaired t test).

(G) Spatial distribution of late-G1 ECs in the PCV at 26 and 42 hpf (n26 hpf embryos = 11; n42 hpf embryos =9 ). Data show mean ± SEM (unpaired t test).

(H–O) Selected snapshots from a time-lapse series of a Tg(fli1a:Gal4FF;UAS:FUCCI;UAS:Kaede) embryo showing two different ECs budding off the PCV in late-G1 stage (H and L, white arrowheads) and re-entering cell cycle upon crossing the DA (K and N, purple arrowhead).

(P–S) Confocal images of 30 (P and R) and 48 (Q and S) hpf Tg(fli1:EGFP) embryos immuno-stained with p53 (P and Q, light-blue arrowheads) or p27 (R and S, light-blue arrowheads) antibodies. Co-localization channel is shown in yellow, and PCV is outlined by dashed lines.

(T and U) Spatial distribution of p53+ (n30 hpf = 7, n48 hpf = 4) (T) and p27+ (n30 hpf = 18, n48 hpf = 8) (U) ECs in the PCV. Data show mean ± SEM (one-way ANOVA plus Tukey`s post-hoc test). Scale bars: 40 μm (B–E and H–O), 70 μm (P–S); p < 0.05, ∗∗∗p < 0.001, ∗∗∗∗p < 0.0001; ns, not significant.

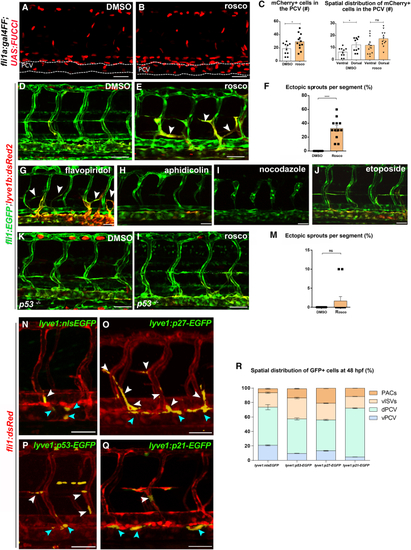
G0/G1 cell-cycle arrest in PCV ECs is mediated by p53, p21, and p27

(A–C) Confocal images of Tg(fli1a:Gal4FF;UAS:FUCCI) (red channel) embryos at 48 hpf, showing increased numbers of late-G1 mCherry+ nuclei, which are evenly distributed throughout the PCV (outlined by dashed lines) following roscovitine versus DMSO treatment (A and B); quantified in (C) (nDMSO = 10, nrosco = 12). Data show mean ± SEM (unpaired t test).

(D and E) Confocal images of 48-hpf Tg(fli1:EGFP;lyve1b:dsRed2) embryos showing ectopic and mis-patterned PCV sprouts following roscovitine treatment (E, arrowheads), which are not detected in DMSO-treated siblings (D).

(F) Number of ectopic sprouts per segment in roscovitine- versus DMSO-treated embryos (nDMSO = 11, nrosco = 12). Data show mean ± SEM (unpaired t test).

(G–J) Confocal images of 3-dfp Tg(fli1:EGFP;lyve1b:dsRed2) embryos treated with flavopiridol (J, n = 14), aphidicolin (G, n = 6), nocodazole (H, n = 11), or etoposide (I, n = 11), showing ectopic and mis-patterned PCV sprouts following flavopiridol treatment (J, arrowheads).

(K and L) Confocal images of Tg(fli1:EGFP;lyve1b:dsRed2;p53−/−) embryos at 48 hpf, showing normal PACs following DMSO (K) and roscovitine (L, arrowheads) treatments.

(M) Percentage of ectopic sprouts per segment in roscovitine-treated (n = 12) versus DMSO-treated (n = 12) p53−/− embryos. Data show mean ± SEM (unpaired t test).

(N–P) Confocal images of Tg(fli1:DsRed) embryos 48 after injection with lyve1:nEGFP (N, n = 12), lyve1:p27-EGFP (O, n = 12), or lyve1:p53-EGFP (P, n = 30).

(Q) Confocal images of Tg(fli1:DsRed;lyve1:p21-EGFP) embryos at 48 hpf. Light-blue arrowheads in (N)–(Q) point to GFP+ ECs in the dorsal PCV, white arrowheads denote GFP+ lymphovenous sprouts, and co-localization channel is shown in yellow.

(R) Spatial distribution of GFP+ cells in lyve1:nEGFP-, lyve1:p27-EGFP-, lyve1:p53-EGFP-, and lyve1:p21-EGFP-expressing embryos. Scale bars: 40 μm (A–L), 50 μm (N–Q). p < 0.05, ∗∗∗∗p < 0.0001; ns, not significant.

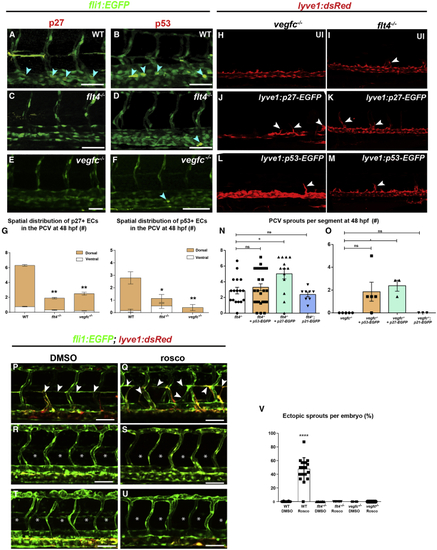
Cell-cycle arrest in dorsal PCV ECs is VegfC/VegfR3 dependent

(A–F) Confocal images of 48-hpf WT (A and B), flt4−/− (C and D), and vegfc−/− (E and F); Tg(fli1:EGFP) embryos, stained with p27 (A, C, and E) or p53 (B, D, and F) antibodies. Light-blue arrowheads point to immunostained ECs, and co-localization channel is shown in yellow.

(G) Number and spatial distribution of p27- and p53-stained ECs, in the PCV of WT, flt4−/−, and vegfc−/−; Tg(fli1:EGFP) embryos (np27 wt = 19, np27flt4−/− = 8, np27 vegfc−/− = 10, np53 WT = 17, np53flt4−/− = 15, np53vegfc−/− = 5). Statistical analysis was performed using one-way ANOVA followed by Tukey’s multiple comparisons test.

(H–M) Confocal images of 48-hpf vegfc−/− (H, J, and L) and flt4−/− (I, K, and M); Tg(lyve1b:dsRed2) embryos, uninjected (H and I, nvegfc−/− = 5, nflt4−/− = 17) or injected with lyve1:p27-EGFP (J and K) or lyve1:p53-EGFP (L and M). White arrowheads point to PCV emerging sprouts.

(N) Number of ectopic sprouts per segment in flt4−/−;Tg(lyve1b:dsRed2) embryos injected with lyve1:p27-EGFP (n = 13) or lyve1:p53-EGFP (n = 26) or stably expressing lyve1:p21-EGFP (n = 8). Statistical analysis was performed using Kruskal-Wallis followed by Dunnett's multiple comparisons test.

(O) Number of ectopic sprouts per segment in vegfc−/−;Tg(lyve1b:dsRed2) embryos injected with lyve1:p27-EGFP (n = 3) or lyve1:p53-EGFP (n = 5) or stably expressing lyve1:p21-EGFP (n = 3). Statistical analysis was performed using Kruskal-Wallis followed by Dunnett's multiple comparisons test.

(P–V) Confocal images of WT (P and Q), flt4−/− (R and S), and vegfc−/− (T and U); Tg(fli1:EGFP;lyve1b:dsRed2) embryos at 3 days post-fertilization (dpf), treated with DMSO (nWT = 24, nflt4−/− = 10, nvegfc−/− = 6) or roscovitine (nWT = 19, nflt4−/− = 8, nvegfc−/− = 10). Statistical analysis was performed using one-way ANOVA followed by Tukey’s multiple comparisons test. White arrowheads in (P) and (Q) point to normal and ectopic lymphovenous sprouts that are absent in flt4 and vegfc mutants (R–U, asterisks); quantified in (V). p < 0.05, ∗∗∗p < 0.001, ∗∗∗∗p < 0.0001; ns, not significant. Scale bars: 70 μm.

Cell-cycle arrest acts downstream to ERK signaling in PCV ECs

(A–E) Confocal images of 48-hpf Tg(mrc1a:EGFP) embryos treated with DMSO (A), roscovitine (B), SL327 (C), or roscovitine+SL327 (D) showing partial rescue of lymphovenous sprouting following roscovitine + SL327 (D) treatment, and quantified in (E) (nDMSO = 12, nrosco = 13, nSL327 = 17, nrosco+SL327 = 16). Statistical analysis was performed using one-way ANOVA followed by Tukey’s multiple comparisons test. Blue arrowheads in (A)–(D) point to PCV sprouts.

(F–L) Confocal images of Tg(fli1:dsRed2) embryos treated with DMSO (F and H) or SL327 (G, I, J, and K) stably expressing lyve1:p21-EGFP (H and I) or injected with lyve1:p53-EGFP (J) or lyve1:p27-EGFP (K), showing partially restored lymphovenous sprouting, and quantified in (L) (nDMSO = 7, nSL327 = 26, nlyve1:p21-EGFP+DMSO = 7, nlyve1:p21-EGFP+SL327 = 15, nlyve1:p27-EGFP+SL327 = 17, nlyve1:p53-EGFP+SL327 = 25). Statistical analysis was performed using one-way ANOVA followed by Tukey’s multiple comparisons test. Light-blue arrowheads in (H)–(K) point to GFP+ ECs in the dorsal PCV, white arrowheads denote GFP+ lymphovenous sprouts, and co-localization channel is shown in yellow.

(M–P) Confocal images of 34-hpf Tg(mrc1a:EGFP) embryos showing reduced expression of p27 (M and N) and p53 (O and P) following SL327 treatment, and quantified in (Q and R) (nDMSO p27 = 7, nSL327 p27 = 8, nDMSO p53 = 9, nSL327 p53 = 6). Data show mean ± SEM (unpaired t test). Co-localization channel is shown in yellow. p < 0.05, ∗∗p < 0.01, ∗∗∗p < 0.001, ∗∗∗∗p < 0.0001; ns, not significant. Scale bars: 30 μm

(A–C) In situ hybridization at 24 and 30 hpf showing reduced expression of lyve1 (A) and nr2f2 (B) following roscovitine treatment. ephb4a expression remains unchanged (C). (D and E) Confocal images of 28-hpf Tg(fli1:EGFP;prox1a:kalt4:UAS:uncTagRFP) embryos showing reduced numbers of prox1+ cells (light-blue arrowheads) in the PCV upon roscovitine treatment. Co-localization channel is shown in yellow; quantified in (F). Data show mean ± SEM (unpaired t test). (G–L) Selected images from a time-lapse series depicting the dynamics of PCV sprouting in the presence of roscovitine. Two ECs (colored in red and blue) leave the PCV as part of a single sprout (G) that generates two vessel types. The leading EC (red) connects to an arterial ISV to generate a vISV (I and J); the following cell (blue) divides (J) and gives rise to 2 daughter cells (K and L, yellow arrowheads), with one joining a vISV and the second one incorporating into the nascent PAC. (M) Schematic model depicting cellular events inducing cell-cycle-arrest-induced sprouting. Dorsal cells of the PCV sense high levels of Vegfc (purple) secreted from the hypocord and the DA. Activation of Vegfr3/Flt4-ERK signaling in these cells leads to cell-cycle-arrest-induced sprouting.

Acknowledgments
This image is the copyrighted work of the attributed author or publisher, and ZFIN has permission only to display this image to its users. Additional permissions should be obtained from the applicable author or publisher of the image. Full text @ Cell Rep.