
- Title
-
The Great Capacity on Promoting Melanogenesis of Three Compatible Components in Vernonia anthelmintica (L.) Willd.
- Authors
- Lai, Y., Feng, Q., Zhang, R., Shang, J., Zhong, H.
- Source
- Full text @ Int. J. Mol. Sci.

Cytotoxicity of compounds toward B1610 Cells. (A) B16 cells incubated with various concentrations [10−6, 10−4, 10−2, 10−1, 1, 5, 10, 15, 20] μmol·L−1 of butin for 48 h; (B,C) B16 cells incubated with various concentrations of luteolin and caffeic acid for 48 h. cell viability was determined using an MTT assay. Results shown are mean ± SEM and are representative of three independent experiments. Data were analyzed by one-way analysis of variance (ANOVA) followed by post hoc Tukey test. * p < 0.05, ** p < 0.01, *** p < 0.001 vs. Control. The dotted line indicates the relative viability of 75% of the cells. |
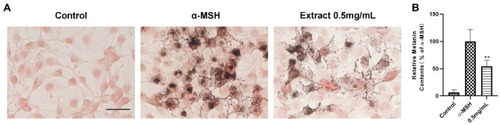
Extract of Vernonia anthelmintica (L.) Willd. induces melanogenesis. (A) Masson-Fontana melanin ammonia silver stain assay to test extract of Vernonia anthelmintica (L.) Willd. and α-MSH (20 nM) melanogenesis effect on B16F10 cells contrast to Control. Cells were treated for 48 h. The scale bars represent 50 μm. (B) Collecting B16 cells in each group for testing melanin content (relative melanin contents % of α-MSH), results shown are mean ± SEM. Data were analyzed by ANOVA followed by post hoc Tukey test, ** p < 0.01 vs. α-MSH. |

Compounds promote melanin synthesis on B16F10 cells. (A) Cells incubated with various concentration of butin [0.1, 1, 10] μmol·L−1, luteolin [1, 10, 40] μmol·L−1 and caffeic acid [0.1, 1, 5] μmol·L−1 to test melanogenesis effect contrast to α-MSH (20 nM) group and control group. Cells were treated for 48 h. The scale bars represent 30 μm. (B–D) are melanin contents (relative melanin contents % of α-MSH) in butin, luteolin and caffeic acid groups, results shown are mean ± SEM. Data were analyzed by ANOVA followed by post hoc Tukey test, ns, non-significant, * p < 0.05, ** p < 0.01, *** p < 0.001 vs. α-MSH. |
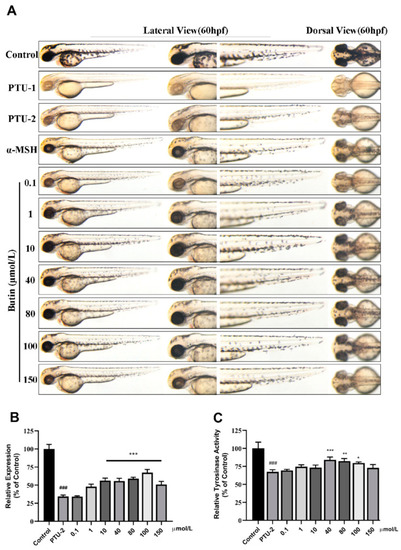
Effect of butin on melanogenesis in vivo. (A) Zebrafish melanin phenotype in various concentrations of butin [0.1, 1, 10, 40, 80, 100 and 150] μmol·L−1, the α-MSH is 60 μmol·L−1, and the PTU-1 group was not washed at all while the PTU-2 group was washed before administration. The control, PTU-1, PTU-2 and α-MSH groups share with caffeic acid and luteolin. (B) Collecting zebrafish in each group for testing melanin content (relative expression % of control). (C) Tyrosinase activity in zebrafish exposure to butin for 24 h. In (B,C), results shown are mean ± SEM. Data were analyzed by ANOVA followed by post hoc Tukey test. n = 30 zebrafish, ### p<0.001 vs. Control, *** p < 0.001, ** p < 0.01, * p < 0.05 vs. PTU-2. |

Effect of caffeic acid on melanogenesis in vivo. ( |

Effect of luteolin on melanogenesis in vivo. ( |
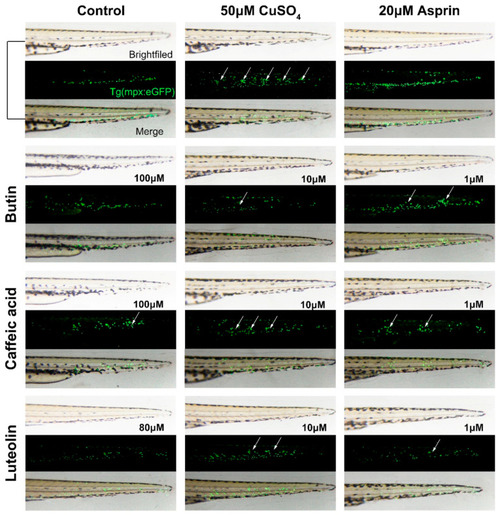
The anti-inflammatory effect of compounds in the chemically induced inflammation model. The time of image acquisition was when Tg(mpx:GFP) zebrafish larvae develop to 56 hpf. Currently, transgenic zebrafish larvae exhibit green fluorescent leukocytes. Untreated fish (control) show the normal distribution of labeled cells, mostly localized in the ventral trunk and tail. In copper-treated siblings (50 μM CuSO4), leukocytes become localized preferentially to a few clusters along the horizontal midline of the trunk and tail (see white arrows); no overt tissue damage to the larvae is observed in bright-field images., and relieving inflammation by applying aspirin (20 μM) as a positive standard. Before treated with CuSO4, zebrafish larvae were incubated with butin and caffeic acid [1, 10, 100] μM. |

Figure 8 The inhibition of reactive oxygen species effect of compounds in zebrafish. Zebrafishes (5 dpf) were treated with different doses of butin [1, 10, 100] µM, luteolin [1, 20, 80] µM and caffeic acid [1, 10, 100] µM for 24 h and then H2O2 (500 µM) for 4 h, respectively. DCFH-DA (10 µM) was added to zebrafish for 30 min, and then images were captured. |

The inducing melanogenesis activity and combinational design of components, and response surface methodology and contour plots of melanogenesis effect for component combinations. (A) Zebrafish melanin phenotype in each combination group. (B) The relative of melanin contents (% of control), results shown are mean ± SEM. Data were analyzed by ANOVA followed by post hoc Tukey test. n = 30 zebrafish, ### p < 0.001 vs. control, ns, non-significant, *** p < 0.001, ** p < 0.01, * p < 0.05 vs. PTU-2. (C) 3D response surface of the relative of melanin contents (% of control). (D) The results of this figure were predicted by the data reported in Table 1. |

Validation of mathematical model of drug combination. (A) Zebrafish melanin phenotype in various ratio of compounds (butin-A, caffeic acid-B, and luteolin-C). Each combination group is equal in concentration (100 μM). (B) Collecting zebrafish in each group for testing relative expression (% of control). Group 1, 2 and 3 mean ratio (1:4:10, 1:2.5:3 and 3:1:3) groups. Results shown are mean ± SEM. Data were analyzed by ANOVA followed by post hoc Tukey test. n = 30 zebrafish, ### p < 0.001 vs. Control, *** p < 0.001 vs. PTU-2. |

Combination compounds enhance the expression level of melanogenic genes. By the method of in situ hybridization on whole-mount zebrafish embryos to investigate the effects of the best drugs combination on the expression of melanogenic genes (tyr, mitfa, kit and dct). Zebrafish larvae were incubated with combination of butin, caffeic acid and luteolin (butin:caffeic acid:luteolin = 7.38:28.30:64.32). In 35 hpf, collecting zebrafish and hybridizing with labeled nucleic acid probes. The color rendering (blue) is means expression of specific genes, the red, purple, black and green arrows indicate the expression sites of tyr, mitfa, kit, and dct, respectively. The scale bars represent 300 μm. |