
- Title
-
Stabilin-1 is required for the endothelial clearance of small anionic nanoparticles
- Authors
- Arias-Alpizar, G., Koch, B., Hamelmann, N.M., Neustrup, M.A., Paulusse, J.M.J., Jiskoot, W., Kros, A., Bussmann, J.
- Source
- Full text @ Nanomedicine
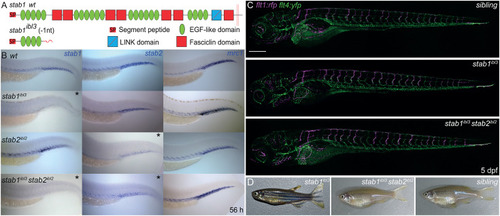
Generation and characterization of stab1 and stab1/stab2 mutants. (A) Schematic representation of a stab1 domain structure predicted to be expressed from the wt Stabilin-1 and the stab1ibl3 allele. (B) In situ hybridization (ISH), mRNA expression of stab1, stab2, and mrc1 in wt, stab1ibl3, stab2ibl2 single mutants and stab1ibl3stab2ibl2 double mutant. *Reduced expression. (C) Tg(fli1:RFP fli4:YFP) stab1ibl3 single mutant, stab1ibl3stab2ibl2 double mutant, and sibling at 5 dpf. Scale bar: 250 μm. (d) Representative fertile adult female stab1ibl3 single mutant, stab1ibl3stab2ibl2 double mutant and sibling zebrafish. |
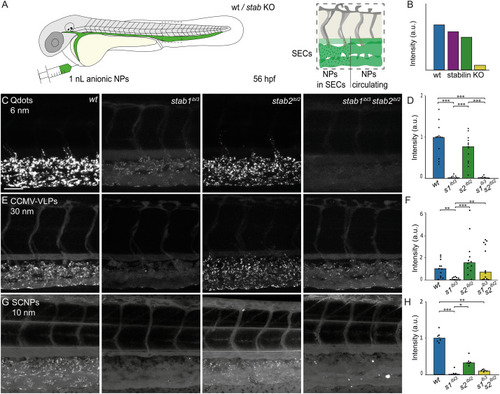
Clearance of small anionic NPs occurs mainly through Stabilin-1. (A) Schematics showing the site of injection within a 56 h post fertilization (hpf) wt or Stabilin knockout zebrafish. In a box, the caudal vein region, where SECs expressing Stabilins are located, a representation of NP circulating or cleared by SECs and (B) representative graph comparing intensity of fluorescent NPs in wt and stab mutants. (C-D) Tissue level view and quantification of fluorescently labeled Qdots. (E-F) CCMV-VLP (G-H) SCNPs. After i.v. injection (1 nL) in wt (AB/TL), stab1ibl3, stab2ibl2 single mutants and stab1ibl3stab2ibl2 double mutants at 1-1.5 hpi. Scale bar: 50 μm. Bar height represents median values, dots represent individual data points, and brackets indicate significant values (*P ˂ 0.05, **P ˂ 0.01, ***P ˂ 0.001) based on Kruskal–Wallis tests followed by two-tailed Dunn’s tests with Bonferroni correction. PHENOTYPE:
|
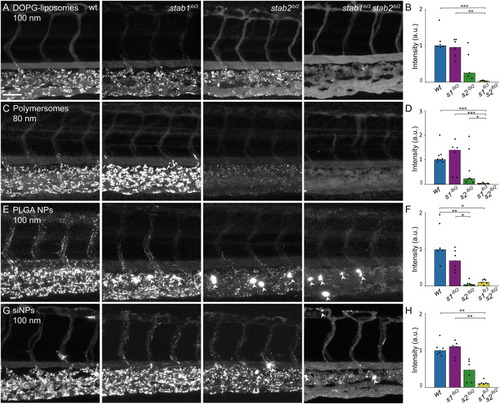
Combined contribution of Stabilin-1 and Stabilin-2 in the clearance of anionic NPs. (A-B) Tissue level view (40×) and quantification of fluorescently labeled DOPG-liposomes, (C-D) polymersomes, (E-F) PLGA NPs, (G-H) siNPs after i.v. injection (1 nL) in wt (AB/TL), stab1ibl3, stab2ibl2 single and stab1ibl3stab2ibl2 double mutants at 1-1.5 h post injection (hpi). White arrows indicate apparent NP uptake within plasma-exposed macrophages. Scale bar: 50 μm. Graphs represent intensity of fluorescent NPs in wt and stab mutants. Bar height represents median values, dots are individual data points, and brackets indicate significant values (*P ˂ 0.05, **P ˂ 0.01, ***P ˂ 0.001) based on Kruskal–Wallis tests followed by two-tailed Dunn’s tests with Bonferroni correction. PHENOTYPE:
|
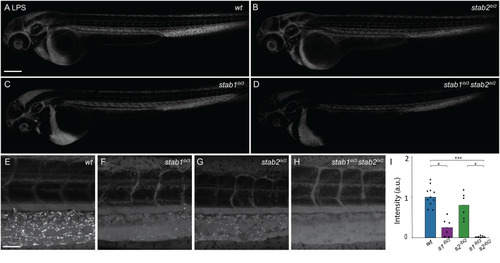
LPS clearance is mediated by Stabilin-1 and Stabilin-2. (A) Biodistribution of Alexa488 LPS (1 nL of 500 μm/mL) in wt (AB/TL), (B) stab2ibl2 mutant, (C) stab1ibl3 mutant, (D) stab1ibl3stab2ibl2 double mutant at 56 hpf, 1.5 hpi, whole body view (10×). Scale bar: 200 μm. (E-H) Tissue level views, caudal region (40×). Scale bar: 50 μm (I) Graph represents intensity of fluorescent LPS in wt and stab mutants. Bar height represents median values, dots represent individual data points, and brackets indicate significant values (*P ˂ 0.05, ***P ˂ 0.001) based on Kruskal–Wallis tests followed by two-tailed Dunn’s tests with Bonferroni correction. The images shown in E-H correspond to the fish used in A-D and are one of the images used for the graph in I. |
Reprinted from Nanomedicine : nanotechnology, biology, and medicine, 34, Arias-Alpizar, G., Koch, B., Hamelmann, N.M., Neustrup, M.A., Paulusse, J.M.J., Jiskoot, W., Kros, A., Bussmann, J., Stabilin-1 is required for the endothelial clearance of small anionic nanoparticles, 102395, Copyright (2021) with permission from Elsevier. Full text @ Nanomedicine