
- Title
-
The orthopedic characterization of cfap298tm304 mutants validate zebrafish to faithfully model human AIS
- Authors
- Laura, M.H., Yasmine, C.B., Raphaël, P., Lotfi, S., Hugues, P.M.
- Source
- Full text @ Sci. Rep.
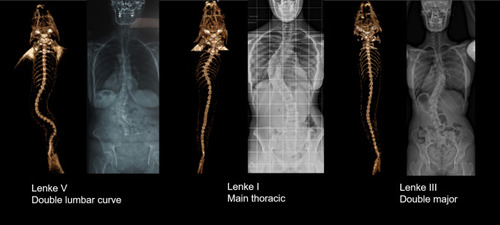
Three examples of frontal 3D-reconstructions of zebrafish’s spine deformities, classified according to Lenke and compared to corresponding human scoliosis. Left: Reconstructions from RaDiant Dicom Viewer 5.0.0 software ( |
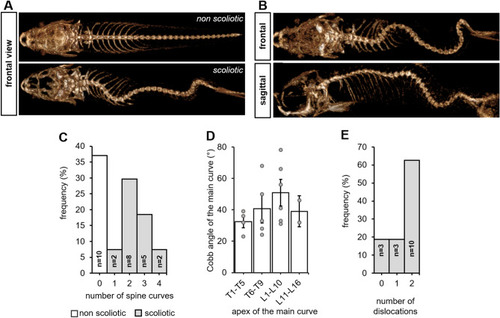
Juvenile cfap298tm304/tm304 zebrafish mutants develop an evolutive thoraco-lumbar curvature of the spine. (A) Frontal views of scannographic reconstructions of 8-week-old non-scoliotic (top) and cfap298tm304 scoliotic sibling (bottom). (B) Frontal and sagittal view of the same cfap298tm304 scoliotic fish after scannographic reconstruction showing a 3-dimensional torsion of the spine reminiscent of AIS. (C) Distribution of the frequency of the number of spine curves observed in the sagittal plane of scoliotic (grey) and non-scoliotic (white) animals. The population analyzed was raised from a cross of cfap298tm304/+ with cfap298tm304/tm304. Most of cfap298 scoliotic animals display double or triple curves in the frontal plane. (D) Distribution of the Cobb angle of the main curve in cfap298 scoliotic fish depending on the localization of the apex of the main curve. Bars represent the average Cobb angles ± SEM. Each point represents a single fish. Most of the main curve apices are located between T6 and L10 (11 out of 17 fish) (E) Histogram showing the distribution of the number of dislocations observed in the scoliotic population (frequency, %). PHENOTYPE:
|
|