
- Title
-
Sexual Dimorphic Distribution of Hypothalamic Tachykinin1 Cells and Their Innervations to GnRH Neurons in the Zebrafish
- Authors
- Ogawa, S., Ramadasan, P.N., Anthonysamy, R., Parhar, I.S.
- Source
- Full text @ Front Endocrinol (Lausanne)
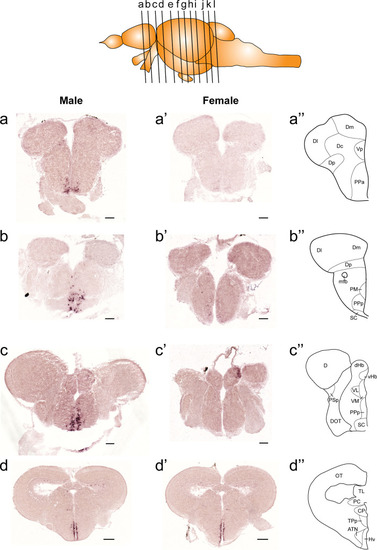
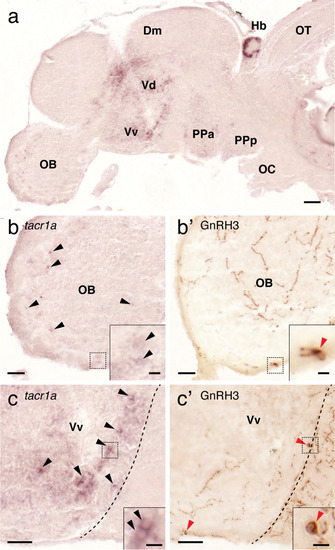
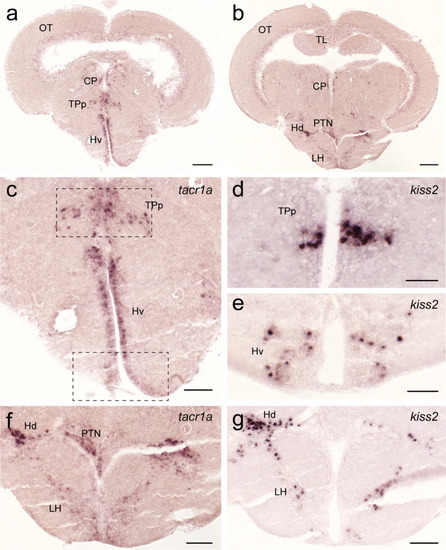
Comparison of expression patterns of EXPRESSION / LABELING:
|
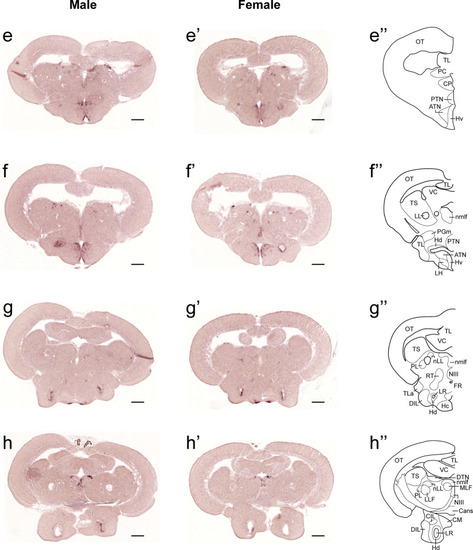
Comparison of expression patterns of EXPRESSION / LABELING:
|

Comparison of expression patterns of EXPRESSION / LABELING:
|
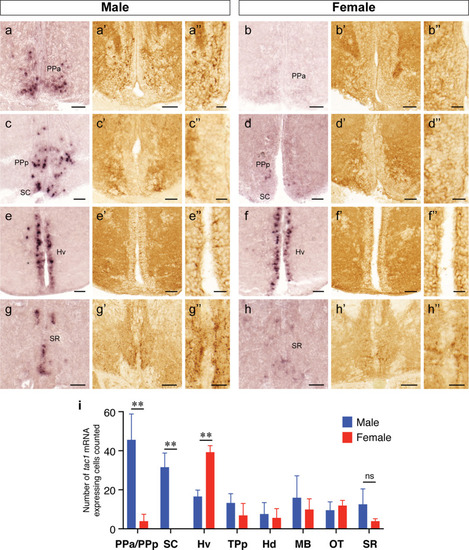
Sexually dimorphic expression of EXPRESSION / LABELING:
|
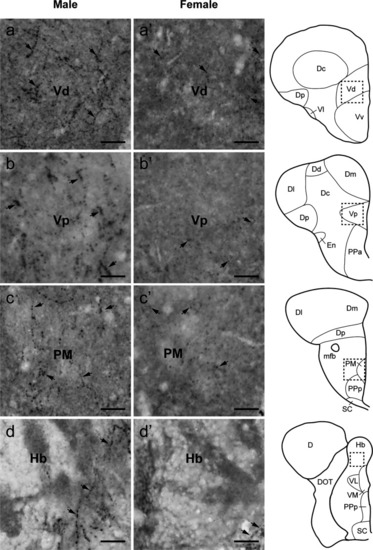
Sexual dimorphisms in Tac1-immunoreactive processes in the telencephalic and diencephalic regions. Left EXPRESSION / LABELING:
|
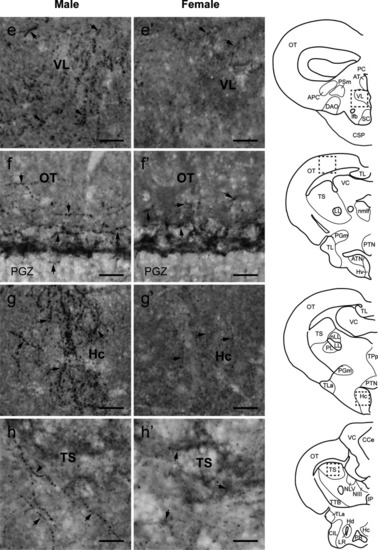
Comparison of Tac1-immunoreactive processes in the diencephalic and mesencephalic regions. Left EXPRESSION / LABELING:
|
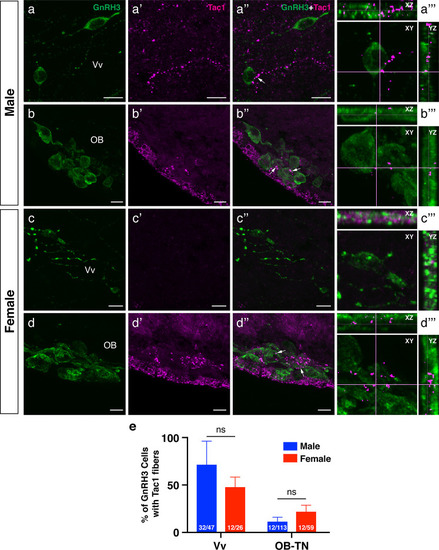
Neuronal association between Tac1-immunoreactive processes and GnRH3 cell soma in the male and female zebrafish. Photomicrographs for immunofluorescence of GnRH3 (1st column, EXPRESSION / LABELING:
|
Neuronal association between Tac1-immunoreactive processes and EXPRESSION / LABELING:
|
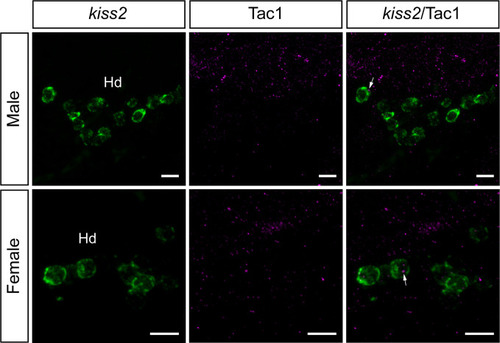
Expression of EXPRESSION / LABELING:
|
Expression of EXPRESSION / LABELING:
|