
- Title
-
Trio cooperates with Myh9 to regulate neural crest-derived craniofacial development
- Authors
- Guo, S., Meng, L., Liu, H., Yuan, L., Zhao, N., Ni, J., Zhang, Y., Ben, J., Li, Y.P., Ma, J.
- Source
- Full text @ Theranostics

trio loss-of-function causes malformation of neural crest derivatives in zebrafish. (A) WISH of trio in zebrafish embryos at 24, 36, 48 and 72 hpf. Bar = 100 μm. At 24 hpf, trio staining was detected in cranial NCC migrating around the eye (blue arrow) and developing ear (red asterisk), and in the NCC on either side of the neural tube (red arrow). Dorsal and lateral views of zebrafish at 36 hpf display prominent staining in the cranial and trunk NCCs (black arrow). Views of embryos at 48 and 72 hpf indicate trio expression around the pharyngeal arch tissues (pa). hpf: hours post-fertilization; WISH: whole-mount in situ hybridization. (B) Western blot showing the trio knockdown efficiency in the trio MO embryos, followed with quantification (n = 3). MO: morpholino. (C) Statistics of deformed, dead, and normal zebrafish embryos after the trio MO injection (n = 200). (D) Bright-field images of con MO embryos and trio MO embryos at 96 hpf. Red dotted line: mandible. Bar = 100 μm. (E) Images of eye iridophore (white arrow) at 96 hpf. Bar = 100 μm. (F) Quantification of eye iridophore amount and distribution at 96 hpf (n = 10). (G) Ventral view of con MO and trio MO embryos by Alcian blue staining at 120 hpf. Bar = 100 μm. Line A served as a baseline for later measurements and was used to normalize line B. Line B represents the distance from line A to the anterior of Meckel's cartilage. (H) Schematic of the ventral view of the pharyngeal arch cartilage structure in zebrafish embryos at 120 hpf. bh: basihyal; cb: ceratobranchial; ch: ceratohyal; hs: hyosymplectic; ih: interhyal; m: Meckel's cartilage; p: palatoquadrate. The quantification of the B/A ratio between con MO and trio MO embryos is shown. (I, J) Ventral (I) and lateral (J) views of 96 hpf Tg(sox10:egfp) con MO and trio MO zebrafish. Red arrowheads indicate mandible. Bar = 500 μm. For (F) and (H), data are represented as mean ± S.E.M. (two-tailed t test **p < 0.01). |

trio morphants show disruption of NCC migration. (A) WISH was performed for the NCC migration marker foxd3 in con MO and trio MO zebrafish embryos. The dorsal and lateral views of 18 hpf and 24 hpf embryos show foxd3 expression in cranial NCC migratory streams (black arrow). Bar = 200 μm. Quantification of the foxd3 mRNA signal detected in control or trio morphant embryos at 18 hpf or 24 hpf (n = 10). (B) Schematic of cranial NCC clusters distribution in the dorsal neural tube region surrounded by two dotted lines in the con MO and trio MO Tg(sox10:egfp) embryos from 12 SS to 16SS. The dots represent centroids of cell clusters, which are defined as two or more cells in contact with each other. Green dots above the midline represents con MO specimens, pink dots below the midline represents trio MO specimen. The middle schematic showed the study area in the fluorescence field. Normalized distances of centroids clusters from the midline in embryos at 12, 14, 16 SS were accounted for studying NCC migration tendency (n = 10). (C) Dorsal view of time-lapse images of con MO and trio MO Tg(sox10:egfp) live zebrafish embryos at 12, 14, and 16 SS. (The white frame highlights the NCCs in the area, while the red arrowhead denoting GFP-positive NCCs). The magnified images show NCCs in trio morphants appearing in the dorsal midline. Bar = 500 μm. NCCs: neural crest cells; SS: somite stage. (D) Lateral view of time-lapse images of con MO and trio MO Tg(sox10:egfp) embryos at 12, 14, 16 SS. The red dotted lines outline the first NCC migratory stream. The white arrows indicate the cranial NCC migratory streams. Bar = 250 μm. Bright field schematics show the location of green fluorescence at 21 hpf. MO: morpholino. (E) PHH3 staining of con MO and trio MO embryos indicates cranial NCC proliferation at 10 SS. Bar = 500 μm. PHH3: phosphohistone H3. (F) TUNEL staining of con MO and trio MO embryos indicates cranial NCC apoptosis at 10 SS. Bar = 500 μm. TUNEL: terminal deoxynucleotidyl transferase dUTP nick end labeling. (G, H) Quantitative analysis of PHH3 and TUNEL positive NCCs in the cranial region in (E) and (F). For (A), (B), (G) and (H), data are represented as mean ± S.E.M. (two-tailed t test **p < 0.01, ns, not significant). |
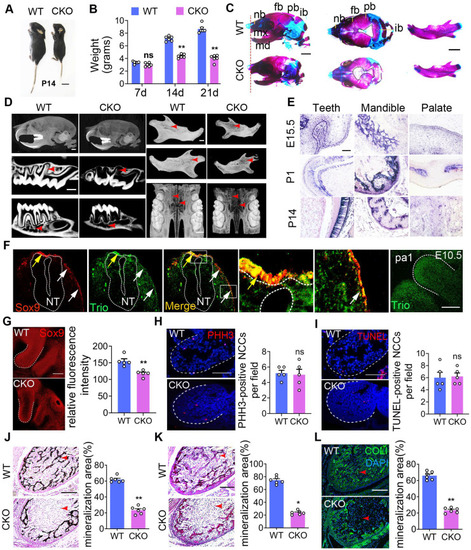
Mice with Trio-deficient NCC-derived tissues show craniofacial defects. Photograph of Triofl/fl (WT) and Wnt1-cre;Triofl/fl (CKO) mice at P14. The CKO image is representative of the smaller body size (see quantification in Figure S2B). Bar = 1 cm. P14, postnatal day 14. (B) Quantitative analysis of WT and CKO mouse weights at P7, P14, and P21 (n = 6). (C) WT and CKO mouse skulls and mandibles stained with Alizarin red and Alcian blue at P1. Bar = 500 μm. (D) Micro-CT image of the skull, teeth, mandible, and palate at P21. CKO mice display a significant reduction in mineralization (red arrowhead) of the skull, teeth, mandible, and palate. Bar = 500 μm. (E) WISH was performed for Trio expression in teeth, mandible, and palate at E15.5, P1, and P14. Blue-violet staining represents Trio anti-sense probe staining. Bar = 50 μm. (F) Immunofluorescence of Trio and Sox9 on sagittal sections of WT mouse embryos at E10.5. The colocalization (yellow) region demonstrates recombination in the premigratory (yellow arrow) and migratory (white arrow) NCC. Magnified images of the white dotted frame are attached to the right. NT: neural tube. The Far-right immunofluorescence of image is the sagittal section of WT mouse, which represents the primary expression of Trio in the pa1. Bar = 50 μm. (G) Immunofluorescence staining of Sox9 for cell migration in E9.5 CKO and WT embryos, with quantitative analysis (n = 5). Bar = 50 μm. (H) Immunofluorescence staining of PHH3 (red) for cell proliferation in sagittal sections through pa1 in E10.5 WT and CKO embryos. Bar = 50 μm. (I) Immunofluorescence staining with TUNEL assay (red) for cell death in sagittal sections through pa1 in E10.5 WT and CKO embryos. Bar = 50 μm. (J-L) Von Kossa (J), total collagen (K), and Collagen I (L) histologic staining of the mandible at P1, with quantification (n = 6). Red arrowhead: mineralization area. Bar = 100 μm. COL I, Collagen I. For (B), (G) - (L), data are represented as mean ± S.E.M. (two-tailed t test *p < 0.05, **p < 0.01, ns, not significant). |

Trio knockdown in NCCs negatively affects cell differentiation and migration in vitro. (A) Wound healing assays conducted and photographed at 0, 12, and 24 h, with quantification (n = 5). Bar = 200 μm. (B and C) Transwell migration assay of NCCs at 24 and 36 h after Trio knockdown, with quantification (n = 5). Bar = 100 μm. (D) Immunostaining of F-actin (red) in the cytoskeleton of shCtrl and shTrio NCCs, with quantification (n = 5). Nuclei were counterstained with DAPI (blue). Bar = 100 μm. DAPI: 4, 6-diamidino-2-phenylindole. (E) Immunostaining for β-tubulin (green) in the cytoskeleton of shCtrl and shTrio NCCs. The nuclei were counterstained with DAPI (blue). Bar = 100 μm. (F) Osteogenesis assessment using alkaline phosphatase (ALP) staining with quantification of NCC differentiation after five days of incubation in osteogenic medium (n = 8). Bar = 100 μm. shCtrl: short hairpin control (control lentivirus); shTrio: short hairpin Trio (Trio lentivirus). (G) Osteogenic differentiation assessment using Alizarin red staining (ARS) in NCCs after 14 days of incubation in osteogenic medium, with quantification (n = 8). Bar = 100 μm. (H) CCK8 assay at 0, 1, 3, 5, 7 days (n = 5). (I) Cell fractions of different phases detected by cytometry (n = 3). (J) Cell apoptosis measured by cytometry, with quantification analysis (n = 3). For (A) - (D) and (F) - (J), data are represented mean ± S.E.M. (two-tailed t test *p < 0.05, **p < 0.01, ns, not significant). |
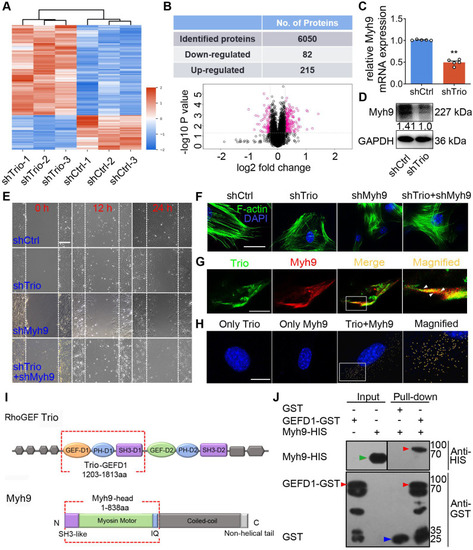
Trio positively modulates Myh9 expression and physically interacts with Myh9 in NCCs. (A) Heat map illustrating protein level changes following Trio knockdown in NCCs. The red and blue colors indicate higher and lower relative expression of proteins in shTrio compared to shCtrl, respectively. (B) Table quantifying the number of differentially expressed proteins (DEPs) and volcano plot demonstrating downregulated (red dots on the left) and upregulated proteins (red dots on the right) between the shCtrl and shTrio groups. (C) qRT-PCR of the Myh9 mRNA level in shCtrl and shTrio NCCs (n = 5). (D) Western blot of Myh9 protein expression between shCtrl and shTrio NCCs. (E) Wound healing analysis of the shCtrl, shTrio, shMyh9, and shTrio + shMyh9 groups at 0, 12 and 24 h. Bar = 200 μm. (F) Confocal microscopy images of F-actin (green) demonstrating NCC cytoskeleton morphology in the shCtrl, shTrio, shMyh9 and shTrio +shMyh9 groups. The nuclei were counterstained with DAPI (blue). Bar = 200 μm. (G) Colocalization (yellow) of immunostained Trio (green) and Myh9 (red). Bar = 200 μm. (H) PLA detection and visualization of Trio and Myh9 in NCCs. Blue: DAPI nuclear staining. Yellow spots: PLA signals. Bar = 400 μm. (I) Domain architecture of RhoGEF Trio and Myh9. Trio-GEFD1 and the Myh9 head domain shown in red frames highlight the binding domains. (J) Pull-down analysis of potential Trio and Myh9 interactions. Bound proteins were separated by SDS-PAGE in duplicate and analyzed by western blot with anti-HIS (Histidine) and anti-GST (Glutathione S-transferase) antibodies. The red arrow at 96 kDa indicates Trio-GEFD1, the green arrow at 68 kDa indicates Myh9, and the blue arrow at 25 kDa indicates GST. |
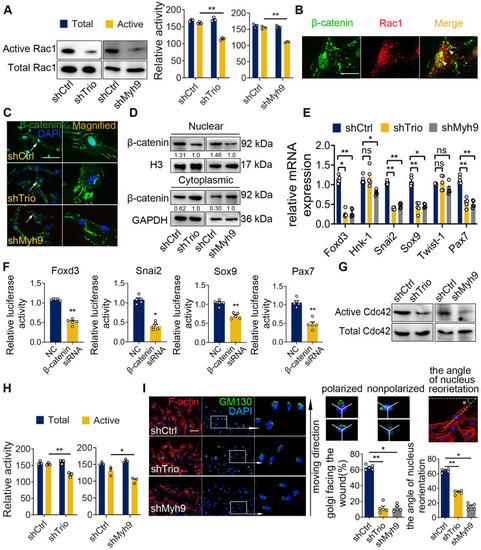
Myh9 assists Trio in the regulation of NCC migration via Rac1 and Cdc42 GTPase activation. (A) Rac1 pull-down activation in the shCtrl, shTrio, and shMyh9 NCC groups, with quantification (n = 3). (B) Immunostaining of β-catenin (green) and Rac1 (red) in NCCs. Bar = 100 μm. (C) Immunostaining of β-catenin (green) and DAPI (blue) for nuclear β-catenin expression indicated by a white arrow in shTrio and shMyh9 NCCs. Bar = 100 μm. (D) Western blot of β-catenin in the nucleus and cytoplasm in the shTrio and shMyh9 NCC groups. (E) qRT-PCR of migratory NCC marker genes (Foxd3, Hnk-1, Snai2, Sox9, Twist-1, Pax7) expression (n = 5). (F) Dual-luciferase reporter assay of relative NCC marker genes (Foxd3, Snai2, Sox9, Pax7) influenced by β-catenin (n = 5). (G and H) Cdc42 pull-down activation assay in the shTrio and shMyh9 NCC groups, with quantification (n = 3). (I) Immunofluorescence staining of the Golgi body marker GM130 and F-actin for polarization assay. The nuclei were counterstained with DAPI. The following schematic shows a polarized and nonpolarized cell, as well as the angle of nucleus reorientation. Bar = 100 μm. The quantification is shown as the percentage of Golgi facing the wound and the angle of nucleus reorientation (n = 5). For (A), (E), (F), (H), and (I), data are represented as mean ± S.E.M. (two-tailed t test *p < 0.05, **p < 0.01). |
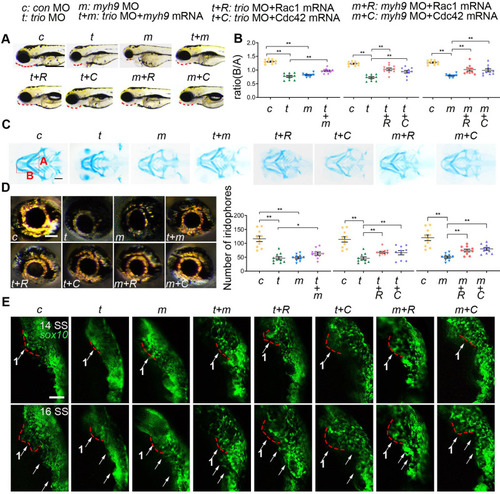
myh9 and ca-Rac1/ca-Cdc42 partly restore the defects in trio morphants. (A) Bright field image of zebrafish embryos at 96 hpf. Bar = 100 μm. Red dotted line: mandible. “+”, coinjection. MO, morpholino. hpf, hours post-fertilization. c: con MO, t: trio MO, m: myh9 MO, t+m: trio MO+myh9 mRNA, t+R: trio MO+Rac1 mRNA, t+C: trio MO+Cdc42 mRNA, m+R: myh9 MO+Rac1 mRNA, m+C: myh9 MO+Cdc42 mRNA. (B, C) Images and quantification of Alcian blue-stained zebrafish embryos at 120 hpf (n = 10). Bar = 500 μm. (D) Eye iridophore amount and distribution of the experimental groups (n = 10). Bar = 100 μm. (E) Time-lapse images of live Tg(sox10:egfp) zebrafish at 14 and 16 SS in the experimental groups mentioned above. Bar = 100 μm. SS, somite stage. For (B) and (D), data are represented as mean ± S.E.M. (two-tailed t test *p < 0.05, **p < 0.01). |