
- Title
-
REP1-deficiency causes systemic dysfunction of lipid metabolism and oxidative stress in choroideremia
- Authors
- Lima Cunha, D., Richardson, R., Tracey-White, D., Abbouda, A., Mitsios, A., Horneffer-van der Sluis, V., Takis, P., Owen, N., Skinner, J., Welch, A.A., Moosajee, M.
- Source
- Full text @ JCI Insight

Global metabolomic analysis of choroideremia (CHM) patients versus age- and sex-matched controls. (A) Principal component analysis (PCA). Control and CHM samples are represented as blue and red circles, respectively (n = 25 each group). (B) Cluster analysis of control and CHM samples show no clear separation between groups. (C) Top 30 metabolites detected by random forest analysis based on importance to group separation. (D) Pathway analysis calculated using MetaboLync pathway analysis (MPA) software. Pathways with MPA score higher than 1 were considered. |
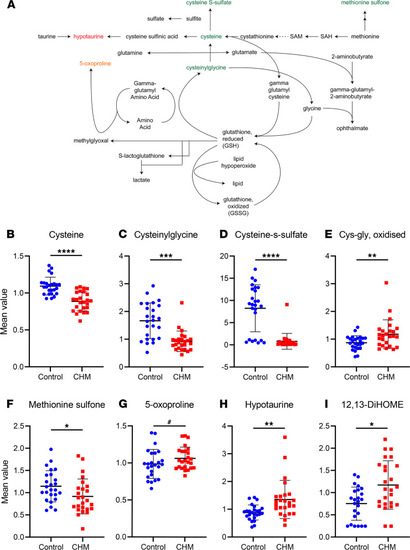
CHM patients exhibit evidence of increased oxidative stress. (A) Schematic of the glutathione metabolism pathway, where several compounds were found to be increased (red) or decreased (green) in CHM patients compared with controls. Metabolites trending to significance (0.05 < P ≤ 0.1) are represented in a lighter shade to distinguish from those significantly altered (P ≤ 0.05). (B–I) Scatter dot plots of specific metabolites indicating the mean ± SD levels in CHM patient samples (red) and control samples (blue) (n = 25). P value was determined using matched pair t tests. #0.05 < P ≤ 0.1, *P ≤ 0.05, **P ≤ 0.01, ***P ≤ 0.001, ****P ≤ 0.0001. |

Alterations in tryptophan and hemoglobin metabolism pathways in CHM patients. (A) Pathway schematics and altered metabolites in tryptophan metabolism with decreased metabolites in green and increased in red. (B–E) Scatter dot plots of altered metabolites showing control (blue) and CHM (red) groups with mean ± SD (n = 25). (F) Schematic representation in the hemoglobin/heme metabolism pathway with decreased metabolites shown in green and increased metabolites in red. (G–J) Scatter dot plots of altered metabolites showing control (blue) and CHM (red) groups with mean ± SD (n = 25). P value was determined using matched pair t tests. #0.05 < P ≤ 0.1, *P ≤ 0.05, **P ≤ 0.01, ***P ≤ 0.001. |

Disturbance of sphingolipid metabolism in CHM patients. (A) General sphingolipid metabolism pathway with compounds differentially detected in CHM patients highlighted in red (increased) or green (decreased) compared with control levels. (B–I) Scatter dot plots of key metabolite levels in both control (blue) and choroideremia (red) plasma samples. Lines indicate mean ± SD (n = 25). P value was determined using matched pair t tests. *P ≤ 0.05, **P ≤ 0.01, ***P ≤ 0.001, ****P ≤ 0.0001. SM, sphingomyelin. |

Metabolites involved in lipid metabolism subclasses differentially detected in CHM patients. (A–E) Bars represent mean ± SD of control (blue) and choroideremia (red) plasma samples (n = 25). P value was determined using matched pair t tests. *P ≤ 0.05, **P ≤ 0.01, ***P ≤ 0.001, ****P ≤ 0.0001. #0.05 < P ≤ 0.1. GPC, glycerophosphocholine; GPE, gylcerophosphoethanolamine; GPS, glycerophosphoserine; 3-Cmpfp, 3-carboxy-4-methyl-5-pentyl-2-furanpropionate; CMPF, 3-carboxy-4-methyl-5-propyl-2-furanpropanoate. |

Lipidomic profiles of zebrafish. (A) PCA of day 6 chm ru848 mutant fish untreated (red squares) or treated with 0.3 nM simvastatin (black squares) or 700 nM fenofibrate (gray squares), compared with WT fish (blue circles). (B–K) Scatter dot plots with key metabolites shared with human plasma metabolites and respective levels detected in all groups. Lines indicate mean ± SD (n = 4, 10 fish per group). P value was determined using 1-way ANOVA. *P ≤ 0.05, **P ≤ 0.01. a.u., arbitrary units; Lyso-PS, lysophosphoserine/1-stearoyl-GPS; Sph(d18:1/22:0), lactosyl-N-behenoyl-sphingosine; S1P, sphingosine-1-phosphate; CAR, carnitine; PC, phosphatidylcholine; SM, sphingomyelin. PHENOTYPE:
|
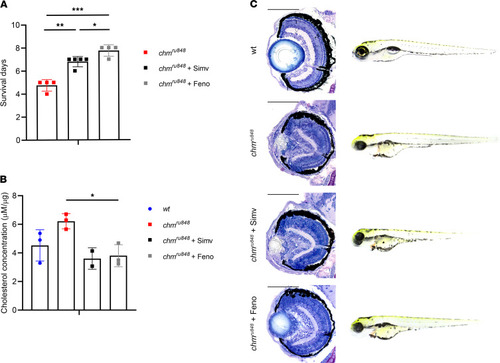
Characterization of chmru848 zebrafish treated daily with 0.3 nM simvastatin or 700 nM fenofibrate from 24 hours after fertilization. (A) Survival days of chmru848 fish untreated (red) or treated with simvastatin (black) or fenofibrate (gray) (n = 4, 50 fish per group). (B) Average levels of cholesterol (μM per μg of protein) in WT fish (blue circles), and chmru848 zebrafish untreated (red squares) or treated with simvastatin (black squares) or with fenofibrate (gray squares) at 6 dpf (n ≥ 2, 5 fish per condition). Data represent mean ± SD. (C) Retinal sections and wholemount morphology of WT, untreated chmru848 fish, and chmru848 fish treated with simvastatin or fenofibrate at 6dpf. Scale bar: 100 μm. P value was determined using 1-way ANOVA. *P ≤ 0.05, **P ≤ 0.01, ***P ≤ 0.001. PHENOTYPE:
|