
- Title
-
Ginsenoside Rb1 Alleviates Alcohol-Induced Liver Injury by Inhibiting Steatosis, Oxidative Stress, and Inflammation
- Authors
- Lai, Y., Tan, Q., Xv, S., Huang, S., Wang, Y., Li, Y., Zeng, T., Mo, C., Chen, Y., Huang, S., Zhou, C., Gao, L., Lv, Z.
- Source
- Full text @ Front Pharmacol
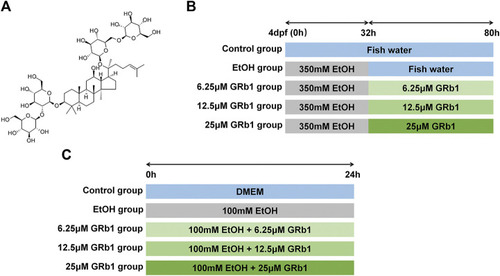
Study design. |

GRb1 alleviates alcohol-induced hepatic steatosis in zebrafish larvae. |
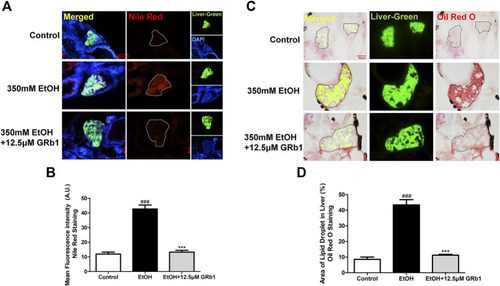
GRb1 significantly ameliorates hepatic steatosis caused by alcohol. |

GRb1 reduces lipid accumulation stimulated by alcohol in L-O2 cells. (A) Oil Red O staining of L-O2 cells. Figures are magnified as 400ⅹ. (B) Quantitative analysis of the area of lipid droplets in L-O2 cells based on Oil Red O staining using ImageJ software. (C) Nile Red staining of L-O2 cells. Figures are magnified as 200ⅹ. (D) Quantitative analysis of the mean fluorescence intensity of Nile Red using ImageJ software. (E) Triglyceride levels in L-O2 cells. The data are displayed as the means ± SEM. p < 0.05 (#), p < 0.01 (##), and p < 0.001 (###) compared the control group; p < 0.05 (*), p < 0.01 (**), and p < 0.001 (***) compared with the 100 mM EtOH group. |

GRb1 protects zebrafish larvae against oxidative stress induced by alcohol exposure. |

GRB1 reduces the oxidative stress caused by alcohol in L-O2 cells. |
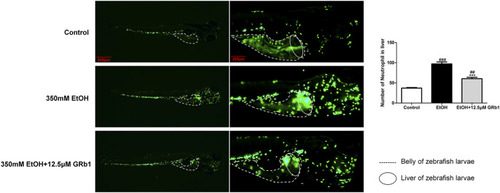
GRb1 alleviates neutrophil infiltration of the liver during acute alcohol injury. Neutrophil fluorescence micrographs and quantification of the number of neutrophils in the liver (within the cycle). After alcohol modeling and GRb1 administration, zebrafish larvae with neutrophil-specific EGFP expression were observed and imaged using an Olympus U-HGLGPS fluorescence microscope (Tokyo, Japan). Figures are magnified as 20 and 50ⅹ. The number of neutrophils in the liver was counted using particle analysis in ImageJ software. Data are presented as the mean ± SEM ( |
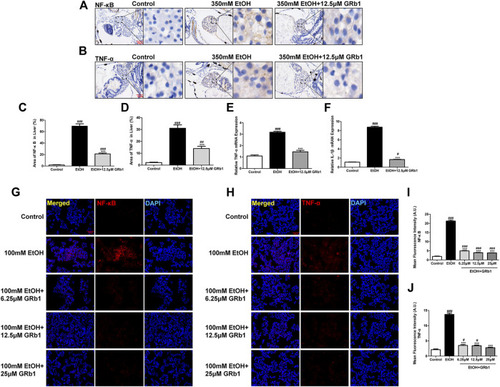
GRb1 downregulates the expression of proinflammatory cytokines. |

Diagram of the protective mechanisms of GRb1 against alcohol-induced liver injury. |