
- Title
-
Identification and functional characterization of the transcription factor coding Dp1 gene in large yellow croaker Pseudosciaena crocea
- Authors
- Cai, X., Huang, Y., Chen, H., Qi, Q., Xu, M., Xu, P., Wu, X.
- Source
- Full text @ Heliyon

The full-length cDNA and deduced amino acid sequences of Pcdp1. The coding region and untranslated regions are indicated in uppercase and lowercase letters, respectively. The initiation codon (ATG) is shaded, and the stop codon (TAA) is indicated by an asterisk. The polyadenylation signal (AATAAAA) are indicated by the wavy line. The DNA binding domain is bolded, the dimerization domain is underlined, and the DEF box is boxed. Leucine-rich nuclear export signals (NES) are shaded with blue. The acidic region is marked in grey. |

Phylogenetic tree analysis of the full-length amino acid sequences of Dp1 from various species. A phylogenetic tree is constructed by neighbor-joining method using MEGA 7.0 with the bootstrap values of 1,000 replicates. Based on the protein sequence, the relations of different organisms are shown by dendrogram graphically. The scale bar and the branch lengths in terms of genetic distance is denoted below the tree. PcDp1 was marked with a triangle. |

Tissue distribution of Pcdp1 in healthy large yellow croaker. The ratio refers to the gene expression in different tissues relative to that in intestine, and target gene expression is normalized to β-actin. Each vertical bar represents the Mean±standard deviation (n = 3). |
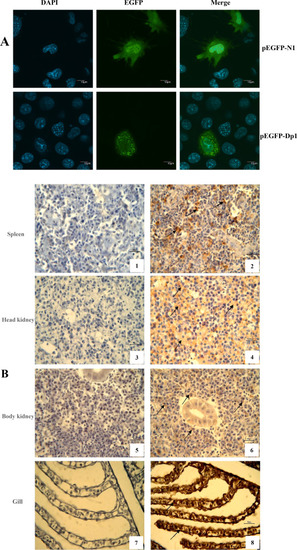
Subcellular localization of PcDp1. (A) Subcellular colocalization of PcDp1 protein analyzed by a GFP reporter assay. COS-7 cells were transfected with GFP reporter constructs expressing an EGFP-tagged Dp1. Empty pEGFP-N1 vector was used as a control. Nuclear DNA was stained with DAPI and cells were analyzed with a fluorescence confocal microscope. Scale bars, 10 μm. (B) Immunohistochemical localization (chocolate brown) of PcDp1 in tissues of health large yellow croaker. The specimens were fixed in 10% buffered formalin, paraffin embedded and sectioned. After antigen retrieval, sections were stained with rabbit polyclonal PcDp1 antisera or control sera, followed by HRP-coupled secondary Ab and visualized by the DAB method. Sections were visualized at 10×100 magnification. The specificity of the PcDp1 staining was confirmed by negative staining patterns observed with the normal rabbit serum staining. Note: 1,2-sections of spleen; 3,4-sections of head kidney; 5,6-sections of kidney; 7,8-sections of gills; 1,3,5,7-control sections; 2,4,6,8-positive sections. Arrows indicate areas of positive reaction in cytoplasm. |

DNA-binding analysis of recombinant PcDp1 protein by EMSA. The purified recombinant PcDp1 protein was incubated with the DIG-labeled probe containing wild-type E2F binding site (wE2F), mutant binding E2F site (mE2F), or competition binding E2F site (cE2F). Complexes were separated on an 8% native PAGE and transferred onto a nylon+ membrane. Lane 1: negative group (without PcDp1 protein); Lane 2: wild E2F site group (PcDp1 protein with wild biotinylated E2F site); Lane 3: mutant E2F site group (PcDp1 protein with wild and mutant biotinylated E2F site); Lane 4: competition E2F site group (PcDp1 protein with wild and competition biotinylated E2F site). |