FIGURE SUMMARY
Title

Dynamic Polarization of Rab11a Modulates Crb2a Localization and Impacts Signaling to Regulate Retinal Neurogenesis

Authors
Clark, B.S., Miesfeld, J.B., Flinn, M.A., Collery, R.F., Link, B.A.
Source
Full text @ Front Cell Dev Biol

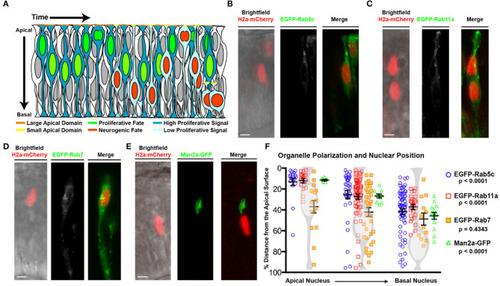
Organelle positioning during interkinetic nuclear migration. (A) Schematic of cellular features correlated with neurogenic and proliferative RPCs, including nuclear position, apical domain size, and proliferative signaling. (B–E) Examples of genetic mosaics of transplanted cells with H2a-mCherry labeled nuclei and endocytic organelles marked by EGFP-fusion proteins. (B) Early endosome (EGFP-Rab5c) localization in cells with apical nuclei. (C) Recycling endosome (EGFP-Rab11a) localization. (D) Late endosome (EGFP-Rab7) localization, and (E) localization of the medial Golgi apparatus (Man2a-GFP). (F) Quantification of the distance of organelles from the apical surface when nuclei are positioned apically (<25% of apical-basal distance), middle (25–50% of apical-basal distance), or basally (>50% of apical-basal distance). Data represent individual organelle positioning with mean and SEM indicated for each organelle type for each bin of nuclear positions from >10 cells/nuclear position bin from >5 embryos/genotype. Statistics represent results of a One-way ANOVA. Scale bars in (B–E) represent 10 μm.

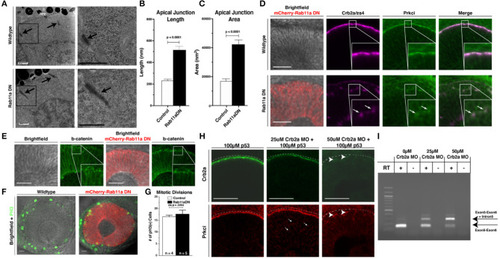
Rab11aDN expression causes Crb2a and Prkci mis-localization, but maintenance of additional features of apical-basal polarity. (A) Electron microscopy images of cells from 34 hpf Control (top panels) and Rab11aDN (bottom panels) retinas. Images are orientated at the apical surface, at the interface of the RPCs and Retinal Pigmented Epithelial (RPE) cells. Apical tight junctions are indicated by the black arrows. Black boxes (left panels) indicate higher magnification regions highlighted in the right panels. Scale bars = 500 nm. (B,C) Quantification of apical junction (B) length and (C) area from 34 hpf TEM images of Control and Rab11aDN-expressing RPCs. (D) Localization of Crb2a and Prkci within 28 hpf Control (top) and Rab11aDN (bottom) retinas. High magnification insets are outlined in the white squares. Arrows indicate ectopic localization of Crb2a and Prkci in Rab11aDN retinas. (E) Maintenance of the adherens junction protein ß-catenin localization in 28 hpf Control (left panels) and Rab11aDN (right panels) retinas. White squares indicate the regions of magnified insets. (F) Localization of mitoses as labeled by PH3 in Control (left) and Rab11aDN (right) retinas. (G) Quantification of the number of cells undergoing mitosis across the entire retina of 28 hpf Control and Rab11aDN retinas. Indicated n's represent total number of retinas quantified (1 retina/embryo). (H) Titration experiment of crb2a morpholino assessing the dosage-dependence of morpholino injection on Crb2a expression and Prkci localization. Increasing amounts of crb2a morpholino result in reduced Crb2a immunostaining and decreased accumulation of Prkci at the apical surface. Arrows indicate sites on non-apical Prkci localization in crb2a morphants, and arrowheads represent remaining Crb2a immunostaining accompanied by apical localization of Prkci staining. Dotted lines are positioned just above the apical surface (interface of RPE and progenitor cells). (I) Agarose gel of resulting PCR bands from RT-PCRs assessing efficiency of the splice-blocking crb2a morpholino within titration experiments. RT indicates the presence or absence of reverse transcriptase during cDNA synthesis. Arrows indicate the expect size of PCR products for the crb2a Exon5-6 junction (lower arrow) or across the crb2a Exon5-6 junction and including the crb2a intron 5. Scale bars in (D–F,H) represent 50 μm. Bar graphs represent mean values with error bars indicating standard error. Apical junction length and area (B,C) were quantified across 12 cells for each genotype, from 4 embryos/genotype. P-values represent statistical results of an unpaired t-test.

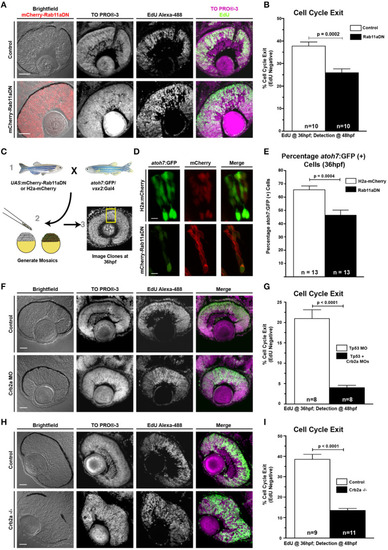
Rab11aDN expression and Crb2a loss-of-function promote RPC proliferation. (A) Representative retinal sections of Control (top) and Rab11aDN (bottom) retinas assessing RPC proliferation through detection of EdU incorporation at 48 hpf after a 12 h pulse from 36 to 48 hpf with nuclei counterstained with ToPRO-3. (B) Quantification of retinal cell cycle exit in Control and Rab11aDN EdU experiments. (C) Experimental design for assessing retinal neurogenesis in Rab11aDN genetic mosaics using the atoh7:GFP neurogenic reporter. (D) Representative images of Control (top) and Rab11aDN (bottom) genetic mosaics assessing retinal neurogenesis (atoh7:GFP). (E) Quantification of percentages of neurogenic cells (atoh7:GFP) in genetic mosaic experiments. Listed n's represent total number of clones assayed across >10 embryos/genotype. (F,H) Representative retinal sections of (F) Crb2a morphant or (H) Crb2a mutant retinas assessing RPC proliferation through detection of EdU incorporation at 48 hpf after a 12 h pulse from 36 to 48 hpf with nuclei counterstained with ToPRO-3. (G,I) Quantification of retinal cell cycle exit comparing Control and either (G) Crb2a morphant or (I) Crb2a mutant embryos. N's in (G,I) represent number of centrally localized retinal sections quantified, with 1 section counted/animal. Bar graphs in (B,G,I) represent mean with error bars indicating SEM. Statistics are the results of an unpaired t-test. Scale bars in (A,C,F) represent 50 μm, with the scale bars in (D) representing 15 μm.

Ectopic expression of the full-length Crb2a promotes RPC proliferation. (A) Schematic of Crb2a function in the regulation of multiple signaling pathways. (B,C) Schematic of the (B) Crb2aFL and (C) Crb2aEXT transgene protein structures. HSE indicates the presence of an 8× repeat of the bi-directional heat-shock element to drive GFP and transgene expression simultaneously. (D–F) Representative images assessing levels of EdU incorporation within transgene clones (GFP), induced with a 30-min heat-shock at 24 hpf, after a 12-h EdU pulse from 36 to 48 hpf in (D) Control (WT background; H2a-mCherry; nlsGFP), (E) Crb2aFL (WT background; Crb2aFL) overexpression, or (F) Rab11aDN/Crb2aFL (Rab11aDN background; Crb2aFL) retinas. (G) Quantification of the percentages of cell cycle exit (EdU negative) within retinal sections. Listed n-values indicate the number of individual embryos counted for each genotype. Data represent the mean percent of cell cycle exit across clones, with error bars indicating SEM. * Indicate p < 0.05 after Tukey's multiple comparisons tests of a One-way ANOVA (p = 0.0002). (H–K) Representative images (>3 embryos assessed/genotype) of transgene overexpression of (H,I) Crb2aFL or (J,K) Crb2aEXT in either (H,J) WT or (I,K) Rab11aDN backgrounds, assessing localization of Crb2a transgene expression (HA tag). White boxes represent regions of highlighted in high magnification insets. Arrows in panel I represent Crb2aFL accumulation in puncta, suggesting accumulation of the transgene within non-plasma membrane associated focal puncta when expressed in the Rab11aDN background. Scale bars represent 50 μm.

Crb2aINT localized to Rab11a recycling endosomes and inhibition of recycling endosome activity promote RPC proliferation. (A) Schematic of the heat-shock inducible transgene to localize the Crb2aINT to EGFP-Rab11a positive recycling endosomes. (B–D) Images assessing cell cycle exit (EdU negative) within clones of (B) Control (nlsGFP; H2a-mCherry). (C) EGFP-Rab11a overexpression (nlsGFP; EGFP-Rab11a) or (D) Crb2aINT localized to Rab11a-positive recycling endosomes (nlsGFP; Crb2aINT-GFP-Rab11a). Transgene expression is induced through heat-shock at 24 hpf, with EdU pulse from 36 to 48 hpf. (E) Quantification of average cell cycle exit across clones. Graph represents mean percentages of cell cycle exit across clones with error bars indicating SEM. Listed n-values represent number of quantified embryos within each genotype. Statistics are the result of a One-way ANOVA (p = 0.002) followed by a Tukey's multiple comparisons test. ***p < 0.001; **p < 0.01. (F) Schematic of the molecular switching of Rab11a from the GTP-bound active form to the GDP-bound inactive form. Hydrolysis of Rab11a-GTP to Rab11a-GDP is mediated by the Rab11a-GAP, Evi5. (G) Comparisons of centrosome localization (Centrin-GFP; left) to transgenic expression of a GFP-tagged Evi5b (right) in 28 hpf RPCs. Both transgenes localize in apical puncta, suggesting conserved localization of Evi5b to peri-centrosome regions within the developing zebrafish retina. (H,I) Representative (n > 5 embryos/genotype) immunostaining assessing Crb2a localization within 32 hpf RPCs after transgenic expression of either (H) Control (mCherry) or (I) Evi5b transgenes. Dotted lines in (H,I) indicate apical domains of transgenic cells, including regions where Crb2a staining is lost at the apical surface in Evi5b transgenic cells in I. Arrow in I indicates non-apical localization of Crb2a. (J,K) Assessment of cell-cycle exit through incorporation of EdU after a 12-h pulse from 36 to 48 hpf in (J) Control (UAS:mCherry) or (K) Evi5b transgenic clones, with transgene expression driven from by vsx2:Gal4 expression in RPCs. (L) Quantification of average cell-cycle exit (Edu-negative cells; 12 h pulse from 36 to 48 hpf) within transgenic clones of 48 hpf retinas. N's represent number of clones assayed from >4 animals/genotype. Bar graph in (L) represent the means with SEM, with statistics indicating the results of an unpaired Student's t-test. Scale bars represent 25 μm. * in B–D indicates cells counted as having exited the cell cycle (EdU negative).

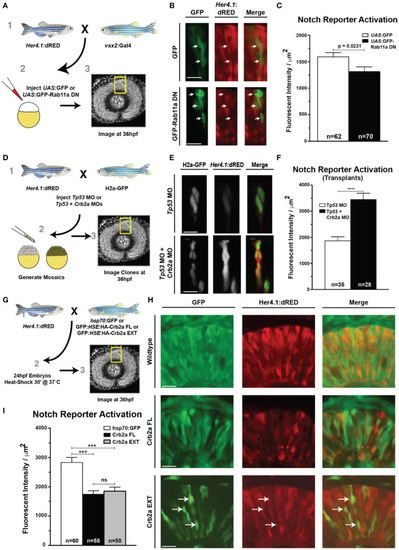
Rab11aDN expression and Crb2a function to inhibit Notch-reporter activation. (A) Schematic of experiments assessing the her4.1:dRED Notch reporter activity in control (UAS:GFP) or (UAS:GFP-Rab11aDN) injected embryos. (B) Representative images of Notch-reporter (her4.1:dRED) activity in control (top) and Rab11aDN (bottom) expressing cells. (C) Quantification of relative Notch-reporter (her4.1:dRED) fluorescence in GFP-labeled cells. (D) Schematic of genetic mosaic experiments for Control (Tp53 MO), her4.1:dRED/H2a:GFP cells or Crb2a morphant (Tp53 + Crb2a MO), her4.1:dRED/H2a:GFP to detect autonomous Notch-reporter activation within a wildtype background. (E) Example of Notch reporter (her4.1:dRED) activation in Control (top) and Crb2a morphant (bottom) clones. (F) Quantification of Notch reporter fluorescent intensities (her4.1:dRED) of Control and Crb2a morphant cells. (G) Schematic of experiments examining the consequence of heat-shock activation of control (GFP), Crb2a-FL, or Crb2a-EXT transgenes on Notch reporter (her4.1:dRED) activation H) Representative images of her4.1:dRED after expression of GFP, Crb2a-FL, Crb2a-EXT transgenes in 36 hpf retinas. Arrows in lower panels indicate locations of high Crb2a-EXT expressing cells that show low activation of the Notch reporter (her4.1:dRED) transgene. (I) Quantification of Notch-reporter activation in Control (GFP), Crb2a-FL, or Crb2a-EXT overexpressing cells. Bar graphs in (C,F,I) represent mean her4.1:dRED Notch reporter activation across individual cells, normalized per unit area, with error bars indicating SEM. Statistics in (C,F) are the result of an unpaired t-test, while statistics in (I) represent results of a One-way ANOVA followed by Tukey's Multiple Comparisons Test. ***p < 0.001; ****p < 0.0001. n-values in (C,F,I) represent number of cells counted from at least five different embryos for each experimental condition. Scale bars represent 25 μm.

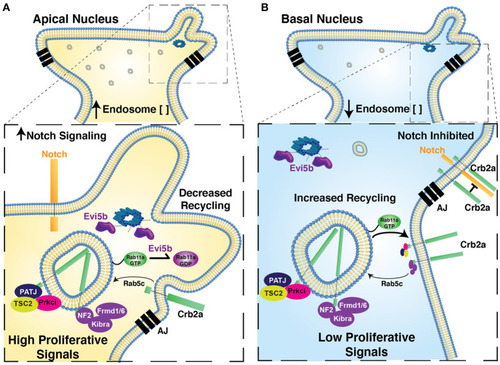
Proposed model for relationship of Nuclear Position, endosome activity, and the regulation of polarized signaling and retinal neurogenesis. Model figure suggesting the functional significance of nuclear position in the regulation of apical endosome concentration, Rab11a recycling endosome activity, the regulation of Crb2a apical protein localization and the regulation of autonomous signaling. In cells with apical nuclei (A) we suggest apical concentration of Rab11a-positive recycling endosomes biases a state in which Rab11a is preferentially in the inactive, GDP-bound form, due to the close proximity of apical recycling endosomes to the centrosome-localized Rab11a-GAP, Evi5b. This in turn decreases recycling of Crb2a to the apical junctions, thereby decreasing the cis-inhibition of Notch signaling by Crb2a (increased Notch signaling) and mis-localizing Crb2a interacting proteins from the apical junction. Combined these changes promote autonomous signaling to promote a proliferative state. In cells with basal nuclei (B) Rab11a is preferentially in a GTP-bound active state, promoting Crb2a recycling, inhibiting Notch-signaling, and maintaining apical localization of Crb2a-interacting proteins. In combination, this biases cells toward an autonomous signaling state that promotes neurogenesis. AJ, Apical Junctions.

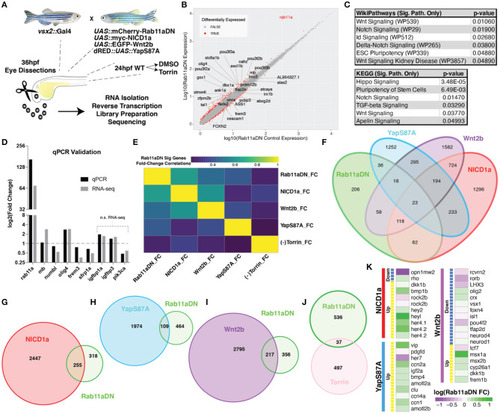
RNA-sequencing of Rab11aDN retinas identifies shared features with modulation of multiple signaling pathways control RPC proliferation. (A) Schematic of genetics for input for RNA-sequencing experiments to test changes in retinal transcript expression resulting from Rab11aDN expression, Notch-pathway activation (NICD1a), Wnt-pathway activation (Wnt2b), inactive Hippo pathway (YapS87A; Yap constitutive active), or inhibition of mTOR signaling (Torin). (B) Global analysis of differentially expressed transcripts in 36 hpf Rab11aDN retinas. Differentially expressed transcripts are indicated in Red. Gene names are listed for differentially expressed transcripts that display high residual to the mean. (C) Target pathways from IPA pathway analysis on Rab11aDN differentially expressed transcripts using WikiPathways (top) and KEGG pathways (bottom). (D) qRT-PCR validation of RNA-sequencing results for transcripts associated with the Notch (mb and numb), Hippo (olig4 and frem3), Wnt (sfrp1a), and mTOR (igfbp1a, igfbp3, pik3ca) pathway modulations. (E) Correlation of the fold changes of differentially expressed transcripts from Rab11aDN experiments with the fold changes observed in additional RNA-seq samples, indicating similarity between transcript signatures. (F–J) Venn diagrams of differentially expressed transcripts across RNA-sequencing samples of (F) All RNA-sequencing samples performed or pairwise comparisons of Rab11aDN differentially expressed transcripts with (G) NICD1a, (H) YapS87A, (I) Wnt2b overexpression studies, or (J) inhibition of mTOR signaling using the Torin inhibitor. (K) Heatmaps of Up- (Yellow) or Down-regulated transcripts within NICD1a, YapS87A, or Wnt2b experiments indicating the corresponding expression fold change in Rab11aDN studies.

Acknowledgments
This image is the copyrighted work of the attributed author or publisher, and ZFIN has permission only to display this image to its users. Additional permissions should be obtained from the applicable author or publisher of the image. Full text @ Front Cell Dev Biol