FIGURE SUMMARY
Title

The Role of DNA Methylation Reprogramming during Sex Determination and Transition in Zebrafish

Authors
Wang, X., Ma, X., Wei, G., Ma, W., Zhang, Z., Chen, X., Gao, L., Liu, Z., Yuan, Y., Yi, L., Wang, J., Tokumoto, T., Huang, J., Chen, D., Zhang, J., Liu, J.
Source
Full text @ Genomics Proteomics Bioinformatics

Analysis of the DNA methylation dynamics during zebrafish germ cell development reveals a unique reprogramming pattern

A. The schematic diagram for zebrafish germ cell developmental stages in this study. Two transgenic strains were used to track the development of germ cells in zebrafish. Dotted boxes indicate the major developmental processes of germ cells at different stages. B. Global DNA methylation levels during zebrafish germ cell development. The methylation level was calculated as the average across all covered CpGs in the genome. DNA methylation data of zebrafish sperm, oocyte, and MBT stages were obtained from GEO: GSE44075. C. A dendrogram showing the clustering of DNA methylomes during zebrafish germ cell development. The R package ‘ape’ was used to perform hierarchical clustering analysis with ‘euclidean’ distance and the ‘complete’ clustering method (500 bp bin for each unit). D. A brief summary of expression patterns of key genes and key biological processes during zebrafish germ cell development. PGC, primordial germ cell; hpf, hours post fertilization; dpf, days post fertilization; dF, days post fertilization female; dM, days post fertilization male; FACS, fluorescence-activated cell sorting; WGBS, whole genome bisulfite sequencing; MBT, midblastula transition.

The DNA methylation reprogramming is associated with zebrafish sexual development

A. Heatmap of DNA methylation levels for DMPs. These DMPs are classified into groups by PAM method. Corresponding GO terms are shown in the right panel and the color represents the enrichment statistical significance. Promoters are defined as 300 bp upstream and downstream of TSSs for each gene (n = 385). B. Snapshot for DNA methylation at 9 dpf-specific hypomethylated promoter of the gene dcn. Y axis represents DNA methylation level from 0 to 1. Each vertical line represents one CpG site. Dynamic regions around the promoter are highlighted in gray. C. Snapshot for DNA methylation at 9 dpf-specific hypermethylated promoter of the gene dazl. D. Heatmap of DNA methylation level (left) and gene expression FC (right) for genes with DMPs at 6 hpf and 9 dpf. Only genes with |log2 FC| > 1 are included. E. Sex ratio within zebrafish populations at 35 dpf, 60 dpf, and 90 dpf after treatment with 5-Aza-dC at different concentrations. The data are represented by mean ± SEM. Statistical significance was calculated by one-way ANOVA. *, P < 0.05; **, P < 0.01; ***. P < 0.001. DMP, differentially methylated promoter; PAM, Partitioning Around Medoid; TSS, transcriptional start site; GO, Gene ontology; FC, fold change; 5-Aza-dC, 5-Aza-2’-deoxycytidine.

The tet3 mutation can cause the reduction of PGC numbers in zebrafish juveniles

A. Histogram of the gene expression levels of tet1/tet2/tet3 in PGCs. Gene expression level was averaged from two biological replicates. B. Schematic diagram showing CRISPR/Cas9 editing in zebrafish tet3 gene, with an 8 bp deletion in exon 3. C. Whole mount in situ hybridization showing expression of vasa mRNA in WT and tet3c1 mutant fish at the 5 dpf stage. D. Number of PGCs at 5 dpf counted under stereoscopic microscope (WT, n = 43; tet3c1, n = 27). The data are represented by mean ± SD. P values are calculated by t-test. **, P < 0.01. WT, wild-type.

Aromasin treatment can induce female-to-male sex transitionin adult zebrafish

A. The schematic diagram for zebrafish SR samples in this study. vasa::egfp transgenic zebrafish was used to induce sex transition by aromasin treatment. The samples include WT ovary, gonads from zebrafish treated with aromasin for 1 month, 2 months, or 3 months, SR testis, and WT testis. B. Observation of gonad morphological change in control female and aromasin-treated fish. Left, gonads under bright filed; middle, GFP fluorescence; right, H&E staining. Red boxes indicate the regions of weak fluorescence of testis. The scale bar in H&E staining indicates 100 µm. C. Time-course clustering analysis of gene expression patterns throughout zebrafish SR process. For the four distinct expression clusters, the left plots of each cluster show the gene expression pattern, the middle tables show the GO enrichment results, and the right plots show dynamics of representative gene expression levels. SR, sex-reversed; H&E, Hematoxylin and Eosin.

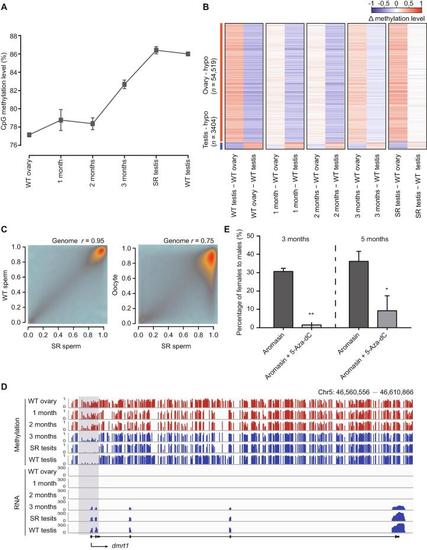
DNA methylomeisresetfrom the female pattern to the male pattern during zebrafish sex transition

A. The global DNA methylation reprogramming during zebrafish sex transition. The methylation level was calculated as the average across all covered CpGs in the genome. The data are represented by mean ± SD. The samples include WT ovary, gonads from zebrafish treated with aromasin for 1 month, 2 months, or 3 months, SR testis, and WT testis. B. The dynamic changes for DMRs between zebrafish ovary and testis during zebrafish sex transition. The Δ methylation heatmap displays the difference in DNA methylation level between two consecutive stages during zebrafish sex transition. ‘n’ represents the number of ovary-specific hypo regions or testis-specific hypo regions. C. The correlation analysis of CpG methylation levels between SR sperm and WT sperm or oocyte. The Pearson correlation coefficients (r) is shown on the top. D. Snapshot of DNA methylation and gene expression tracks for the sex determination gene dmrt1 in WT ovary, gonads from zebrafish treated with aromasin for 1 month, 2 months, or 3 months, SR testis, and WT testis. The promoter of dmrt1 is defined as regions 1000 bp upstream and downstream of the TSS. Dynamic regions around the promoter are highlighted in gray. E. Sex ratio within populations at 3 months (aromasin only, n = 36; aromasin + 5-Aza-dC, n = 47) and 5 months (sex-reversed stage; aromasin only, n = 36; aromasin + 5-Aza-dC, n = 38) after drug treatment. Fish were treated with aromasin only / aromasin + 5-Aza-dC for 3 months, and then raised till 5 months. Three independent experiments were performed for each drug treatment group. The data are represented by mean ± SEM. Statistical significance was calculated by unpaired two-sided t-test. *, P < 0.05; **, P < 0.01. DMR, differentially methylated region; hypo, hypomethylated.

Acknowledgments
This image is the copyrighted work of the attributed author or publisher, and ZFIN has permission only to display this image to its users. Additional permissions should be obtained from the applicable author or publisher of the image. Full text @ Genomics Proteomics Bioinformatics