
- Title
-
Morphological Abnormalities and Gene Expression Changes Caused by High Incubation Temperatures in Zebrafish Xenografts with Human Cancer Cells
- Authors
- Cabezas-Sainz, P., Coppel, C., Pensado-López, A., Fernandez, P., Muinelo-Romay, L., López-López, R., Rubiolo, J.A., Sánchez, L.
- Source
- Full text @ Genes (Basel)
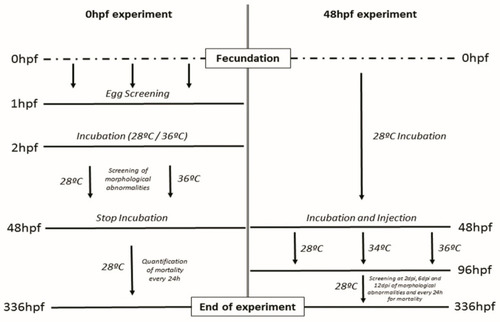
Overview of the two assays starting at two different start points. Hpf = hours post-fertilization. Dpi = days post-injection. |

Mortality quantification at different time points comparing the different incubation conditions of the zebrafish embryos. (A) Mortality quantified at 2 dpi. (B) Mortality quantified at 6 dpi. (C) Mortality quantified at 12 dpi. Parameters are expressed as percentages from the total number of embryos assayed for each condition, comparing the incubation of the embryos from 2 dpi to 12 dpi at 28 °C, 34 °C and 36 °C. Error bars represent the standard deviation (SD). One-way ANOVA was performed, and differences were considered significant when * p < 0.05 (n28 °C = 150, n34 °C = 150, n36 °C = 120). The experiment has been performed in triplicate. |

Morphological abnormalities quantification comparing the different times and incubation temperatures assayed. (A) Spinal deviation. (B) Edema. (C) Head deformation. In all cases, values are expressed as the percentage of the total number of embryos assayed for each condition comparing the incubation of the embryos for 48 h at 28 °C, 34 °C and 36 °C and the posterior recovery at 28 °C until the end of the experiment. Error bars represent the standard deviation (SD). One-way ANOVA was performed, and differences were considered significant when * p < 0.05 (n28°C = 150, n34°C = 150, n36°C = 120). The experiment was performed in triplicate. |

Embryo gene expression analyzed by qPCR after incubation at 28 °C, 34 °C, and 36 °C for 48 h (A) and for 48 h plus 72 h recovery at 28 °C (B). N = 10 embryos/temperature and time point in triplicate. One-way ANOVA was performed, and differences were considered significant when * p < 0.05. ∆ = in the detailed view of marked genes. |