
- Title
-
Calcio-Herbal Medicine Divya-Swasari-Vati Ameliorates SARS-CoV-2 Spike Protein-Induced Pathological Features and Inflammation in Humanized Zebrafish Model by Moderating IL-6 and TNF-α Cytokines
- Authors
- Balkrishna, A., Verma, S., Solleti, S.K., Khandrika, L., Varshney, A.
- Source
- Full text @ J Inflamm Res

Figure 1 Schematic representing the study design for use of Divya-Swasari-Vati (DSV) as a therapeutic against SARS-CoV-2 in a humanized zebrafish model. Treatment end points were studied for 4 and 7 days. A parallel experiment was also setup to study the survival of the different groups for 10 days. Transplanted A549 cells in the swim bladder are highlighted by yellow circles and shown as a magnified image. |

Figure 2 Lateral view of swim bladder with the dorsal region on top and the cranial facing region to the left. The anterior and posterior lobes are labelled. Images were taken at 10X magnification. (A) Normal Control (B). Humanized Zebrafish with xenotransplanted A549 cells (HZF) (C). Diseased fish with SARS-CoV-2 spike protein (HZF-SARS-CoV-2-S) (D). Dexamethasone (0.08 µg/kg) treatment (E). Divya-Swasari-Vati treatment (6 µg/kg) (F). Divya-Swasari-Vati treatment (28 µg/kg) (G). Divya-Swasari-Vati treatment (142 µg/kg). |
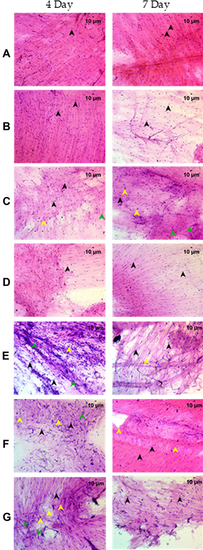
Figure 3 Cytological examination of the whole swim bladder after staining with Hematoxylin and Eosin at 200X magnification. (A) Normal Control (B). Humanized Zebrafish with xenotransplanted A549 cells (HZF) (C). Diseased fish with SARS-CoV-2 spike protein (HZF-SARS-CoV-2-S) (D). Dexamethasone (0.08 µg/kg) treatment (E). Divya-Swasari-Vati treatment (6 µg/kg) (F). Divya-Swasari-Vati treatment (28 µg/kg) (G). Divya-Swasari-Vati treatment (142 µg/kg). Black arrowheads depict the nuclei of normal cells. Green arrowheads show granulocytes and the yellow arrowheads show macrophages. |

Figure 4 Structural examination of the kidney at 10X magnification. The three regions of the kidney Head (H), Trunk or Saddle (S), and Tail (T) extend from the anterior to the posterior of the body. (A) Normal Control (B). Humanized Zebrafish with xenotransplanted A549 cells (HZF) (C). Diseased fish with SARS-CoV-2 spike protein (HZF-SARS-CoV-2-S) (D). Dexamethasone (0.08 µg/kg) treatment (E). Divya-Swasari-Vati treatment (6 µg/kg) (F). Divya-Swasari-Vati treatment (28 µg/kg) (G). Divya-Swasari-Vati treatment (142 µg/kg). |
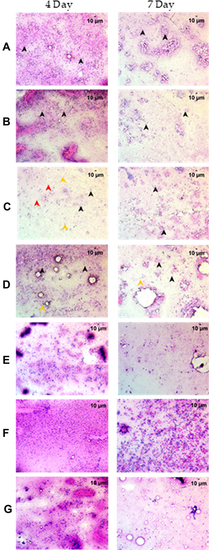
Figure 5 Cytological examination of the kidney after staining with Hematoxylin and Eosin at 200X magnification. (A) Normal Control (B). Humanized zebrafish with xenotransplanted A549 cells (HZF) (C). Diseased fish with SARS-CoV-2 spike protein (HZF-SARS-CoV-2-S) (D). Dexamethasone (0.08 µg/kg) treatment (E). Divya-Swasari-Vati treatment (6 µg/kg) (F). Divya-Swasari-Vati treatment (28 µg/kg) (G). Divya-Swasari-Vati treatment (142 µg/kg). Black arrowheads depict the nuclei of normal cells, yellow represent degenerative cells, while the red arrowheads depict necrotic cells. |

Figure 6 Whole animal imaging for the presence of hemorrhagic regions on the skin. (A) Normal Control (B). Humanized Zebrafish with xenotransplanted A549 cells (HZF) (C). Diseased fish with SARS-CoV-2 spike protein (HZF-SARS-CoV-2-S) (D). Dexamethasone (0.08 µg/kg) treatment (E). Divya-Swasari-Vati treatment (6 µg/kg) (F). Divya-Swasari-Vati treatment (28 µg/kg) (G). Divya-Swasari-Vati treatment (142 µg/kg). |
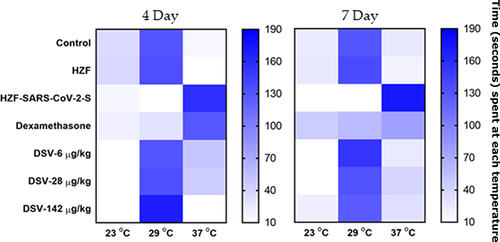
Figure 7 Heat map of behavioral fever. The time spent by individual fish in each temperature chamber is depicted as increased color intensity with an increase in the time spent. Data is presented as a mean of the observations. |

Figure 8 Survival analysis of the different groups of zebrafish presented as a Kaplan–Meier survival curve. |

Figure 9 Gene expression levels of IL-6, IL-10, and TNF-α in vivo. (A) Dexamethasone and DSV at 28 µg/kg and 142 µg/kg showed highly significant (P<0.0001) reduction in the IL-6 expression levels while 6 µg/kg was significant at P<0.001. (B) IL-10 showed highly significant reduction with 142 µg/kg of DSV treatment and with dexamethasone, while the other dosages were not significant. (C) Dexamethasone showed significant (P<0.005) reduction of TNF-α levels at 4 days and P<0.0001 at 7 days. Divya-Swasari-Vati showed similar effects to the dexamethasone group, with 142 µg/kg dosage and only a slight reduction (P<0.05) with 28 µg/kg dosage after 7 days, rest of the treatments were not significant (ns). * P<0.05, ** P<0.05, *** P<0.001, **** P<0.0001. |
Figure 10 Release of IL-6 and TNF-α from human lung (A549) cells post stimulation with IL-1β in vitro. (A) Cell viability was estimated by Alamar blue assay during a 24-hour period. Results are expressed as mean±SD in triplicate analysis. (B) Cells were pre-treated with different concentration of DSV for either 1 day or 3 days before addition of IL-1β and DSV in the desired concentration. Cell supernatant was used in ELISA for the estimation of IL-6 expression 24 hours post-stimulation. Results are expressed as mean±SD in triplicate analysis. (C) Cell supernatant was used for TNF-α expression as above. Results are expressed as mean±SD ## P<0.001 when compared to the normal control (NC) and ** P<0.01 when compared with the IL-1β stimulated control without any test formulation treatments. |
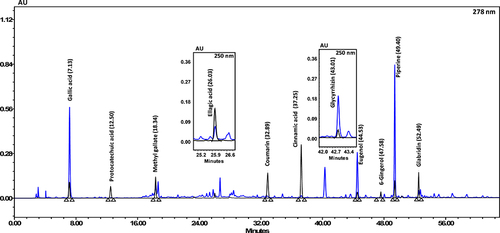
Figure 11 HPLC profile showing the different phyto-compounds identified in Divya-Swasari-Vati used in the present study. The quantified phytochemicals in DSV have been listed in Table 7 |