
- Title
-
Waterborne uranium causes toxic effect and thyroid disruption in zebrafish larvae
- Authors
- Xu, C., Li, T., Hu, C., Guo, H., Ye, J., Li, L., Liu, W., Niu, L.
- Source
- Full text @ Ecotoxicol. Environ. Saf.

Fig. 1. Bioconcentration factors (BCFs) of uranium in zebrafish larvae after exposure for 120 h. |

Fig. 2. Toxic effects, including (a) 24 hpf mortality, (b) 72 hpf hatching rate, (c) 96 hpf malformation rate and (d) typical malformation, on zebrafish larvae after exposure to UO22+. * indicates significantly different at p < 0.05 level. |

Fig. 3. Locomotor activity of zebrafish larvae under alternating light and dark conditions after 120-h UO22+ exposure. (a) Total activity in per minute light/dark period; (b) total activity in each 10-min light/dark period; (c) total activity in 50-min period. The white and black bars at the bottom denote the light and dark periods, respectively. |

Fig. 4. Levels of T4 (a) and T3 (b) in whole bodies of zebrafish larvae after exposure to UO22+ |

Fig. 5. Relative expression of hypothalamic–pituitary–thyroid axis related genes in zebrafish after exposure to UO22+ for 120 h. * indicates significantly different at p < 0.05 level; ** indicates significantly different at p < 0.01 level. |
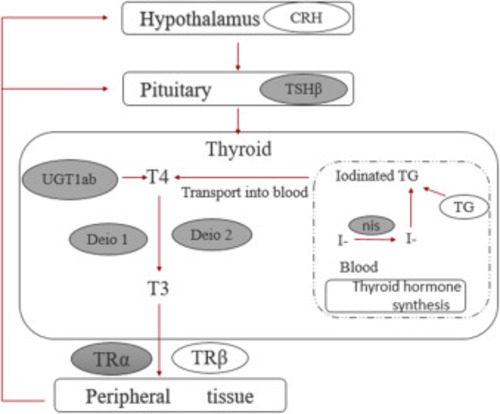
Fig. 6. Schematic diagram of the influence of waterborne uranium exposure on the thyroid endocrine system in zebrafish larvae. Genes with gray background indicate that the mRNA expression levels are significantly lower than those in control. |