
- Title
-
Puerariae Lobatae radix flavonoids and puerarin alleviate alcoholic liver injury in zebrafish by regulating alcohol and lipid metabolism
- Authors
- Liu, Y.S., Yuan, M.H., Zhang, C.Y., Liu, H.M., Liu, J.R., Wei, A.L., Ye, Q., Zeng, B., Li, M.F., Guo, Y.P., Guo, L.
- Source
- Full text @ Biomed. Pharmacother.
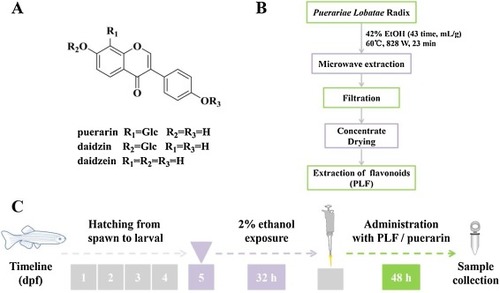
Fig. 1. Effect of Puerariae Lobatae Radix flavonoids (PLF) and puerarin on zebrafish larva model of ethanol-induced hepatic steatosis. (A) Chemical structures of main chemical components of PLF. (B) Microwave extraction of PLF. (C) Experimental outline of the modeling protocol. |

Fig. 2. UPLC-Q Extractive MS spectrometry chromatogram of PLF. |
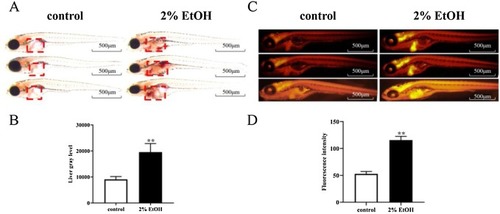
Fig. 3. Staining of controls and models of alcoholic fatty liver disease. (A) Oil red O staining was used to detect hepatic steatosis in response to alcoholic injury in larvae. (B) Quantitative analysis of results of Oil red O staining (ImageJ software, n = 20/group). (C) Nile red staining. (D) Quantitative analysis of results of Nile red staining (n = 20/group). The bars indicate the mean ± SD deviation. **P < 0.005 in comparison with the control group. A value of P < 0.05 was considered statistically significant. |
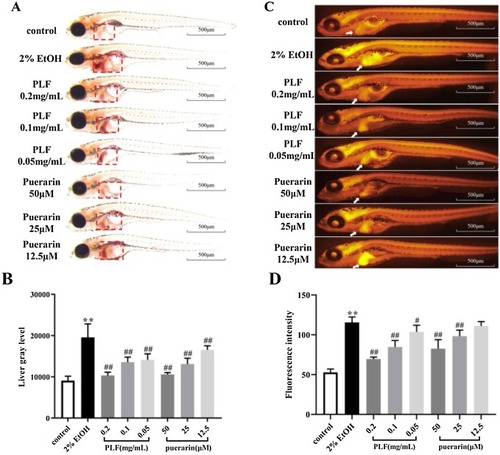
Fig. 4. PLF and puerarin alleviated hepatic steatosis in zebrafish larvae caused by ethanol. (A) Results of Oil red O staining. (B) Quantitative analysis of results of Oil red O staining (n = 10/group). (C) Results of Nile red staining. (D) Quantitative analysis of results of Nile red staining (n = 10/group). **P < 0.005 in comparison with the control group. ##P < 0.005, #P < 0.05 in comparison with the 2 % EtOH group. |
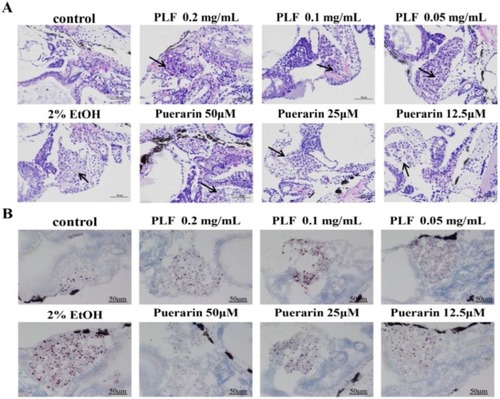
Fig. 5. (A) Results of H&E staining of zebrafish larvae (n = 5/group). (B) Results of frozen Oil red O staining of zebrafish larvae (n = 5/group). Microvesicular steatosis and differences are indicated by black arrows. |
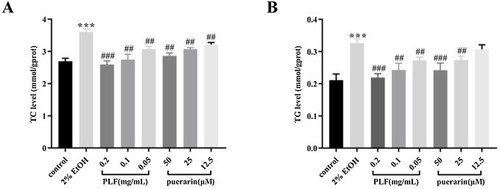
Fig. 6. (A) TC levels in zebrafish in each group. (B) TG levels in zebrafish in each group. n = 25/group. ***P < 0.001 in comparison with the control group. ###P < 0.001, ##P < 0.005 in comparison with the 2 % EtOH group. |
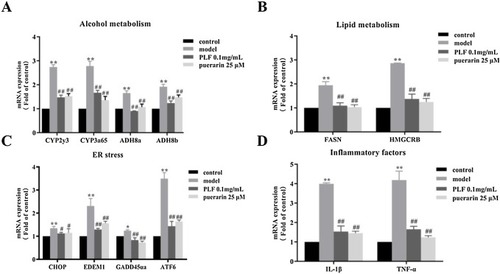
Fig. 7. mRNA expression profiles in PLF and puerarin groups after induction by alcohol of zebrafish larvae and molecular mechanisms. (A) mRNA expression of alcohol metabolism-related genes. (B) mRNA expression of lipid metabolism-related genes. (C) mRNA expression of endoplasmic reticulum stress-related genes. (D) mRNA expression of inflammatory factor-related genes. n = 25/group. **P < 0.005 in comparison with the control group. ##P < 0.005, #P < 0.05 in comparison with the 2 % EtOH group. |
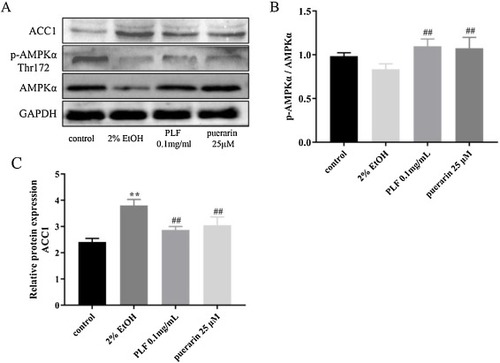
Fig. 8. The effect of PLF and puerarin on protein expression. (A) Protein expression level of AMPKα, p- AMPKα (Thr172) and ACC1. (B) Expression levels of p- AMPKα/AMPKα. (C) Quantitation of western blotting analysis of ACC1. **P < 0.005 in comparison with the control group. ##P < 0.005 in comparison with the 2 % EtOH group. |