FIGURE SUMMARY
Title

Spirulina maxima Derived Pectin Nanoparticles Enhance the Immunomodulation, Stress Tolerance, and Wound Healing in Zebrafish

Authors
Rajapaksha, D.C., Edirisinghe, S.L., Nikapitiya, C., Dananjaya, S., Kwun, H.J., Kim, C.H., Oh, C., Kang, D.H., De Zoysa, M.
Source
Full text @ Mar. Drugs

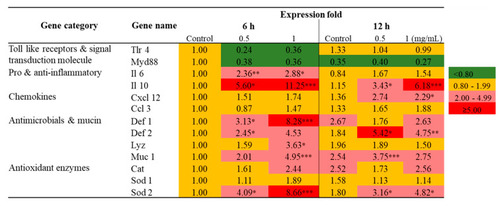
Transcriptional profiling of immune related genes in Raw 264.7 cells exposed to SmPNPs (0.5 and 1 mg/mL) for 6 and 12 h. Data are expressed as means plus or minus standard deviation (± SD) of triplicate samples. Asterisk (*) marks indicate statistical significance compared to SmPNPs treated vs. untreated control (One-way ANOVA * p < 0.05, ** p < 0.01, and *** p < 0.001). Basal level, upregulated, and down regulated expressions are considered as 0.80–1.99-fold, ≥ 2.0-fold, and < 0.80-fold, respectively.

ROS detoxification effect of SmPNPs on A. hydrophila challenged zebrafish larvae. (A) Fluorescence images of head, pericardia, and tail areas were detected as follows: A-1, A-1′; Negative control (without SmPNPs exposure or A. hydrophila challenge), A-2, A-2′; Control (without SmPNPs exposure, but with A. hydrophila challenged), A-3, A-3′; SmPNPs (25 µg/mL) exposed and A. hydrophila challenged, A-4, A-4′ SmPNPs (50 µg/mL) exposed and A. hydrophila challenged. (B) The graph represents the percentage of fluorescence intensity compared to the untreated control group. Values were presented as means plus or minus standard error (± SE), and the asterisk (*) marks are used to indicate the significant difference compared to the respective controls (One-way ANOVA, unpaired two-tailed t-test, * p < 0.05).

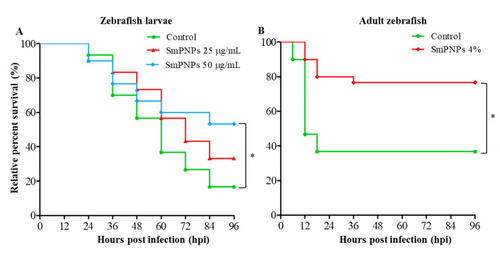
Disease resistance of SmPNPs exposed larvae and adult zebrafish against A. hydrophila infection. Immune challenge of (A) SmPNPs (25 and 50 µg/mL) exposed larvae infected with A. hydrophila (3.3 × 10⁷ CFU/mL) and (B) SmPNPs supplemented (4%) diet fed adults that intraperitoneal injected with A. hydrophila (1.5 × 10⁶ cells/fish). Significant differences (Kaplan-Meier, Wilcoxon; * p < 0.05) between the SmPNPs exposed vs. control were marked with asterisk (*) marks in graphs.

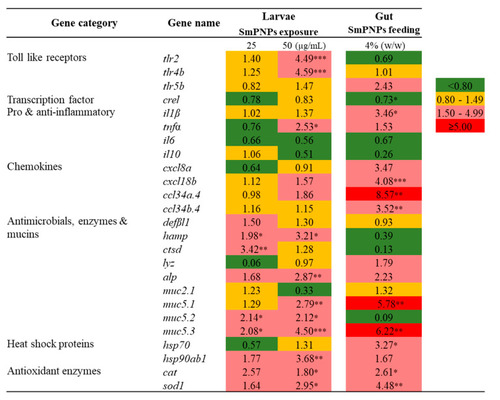
Transcriptional profiling of immune-related genes in zebrafish larvae exposed to SmPNPs (25 and 50 μg/mL) for 5 days and SmPNPs supplemented (4%) diet fed adults for 6 weeks. Data are expressed as means plus or minus standard deviation (± SD) of triplicate samples. Asterisk (*) marks indicate statistical significance compared to SmPNPs treated vs. non-treated control (One-way ANOVA * p < 0.05, ** p < 0.01, *** p < 0.001). Basal level, upregulated and down regulated expressions are considered as 0.80–1.49, ≥ 1.50-fold, and < 0.80-fold, respectively.

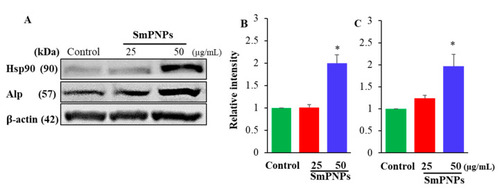
Immunoblotting of heat shock protein 90 (Hsp90) and alkaline phosphatase (Alp) expressions of SmPNPs exposed zebrafish larvae. (A) Immunoblots for Hsp90, Alp, and β-actin (loading control) were performed using whole zebrafish larvae (5 dpf) lysates of SmPNPs exposed (25 and 50 μg/mL) and control larvae. Quantitative analysis of (B) Hsp90 and (C) Alp expressions. Expression folds were normalized to β-actin. Values were presented as means plus or minus standard error (± SE), and the asterisk (*) marks are used to indicate the significant difference compared to the respective controls (One-way ANOVA, unpaired two-tailed t-test, * p < 0.05).

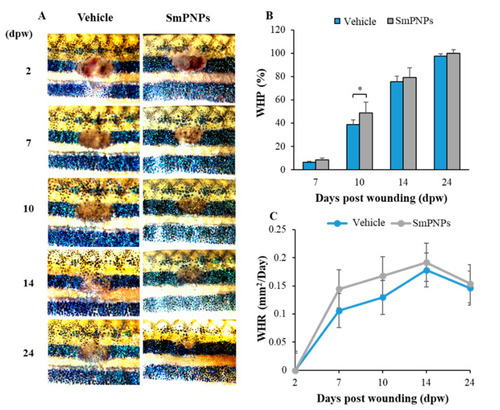
Wound healing effects of SmPNPs on adult zebrafish. (A) Representative images of wound healing process. (B) Wound healing percentage; WHP and (C) Wound healing rate; WHR at 7, 10, 14, and 24 dpw. On each day, WHP was calculated based on the wound size at 2 dpw. Error bars represent the means plus or minus standard deviation (± SD); (Unpaired two-tailed t-test, * p < 0.05, n = 8).

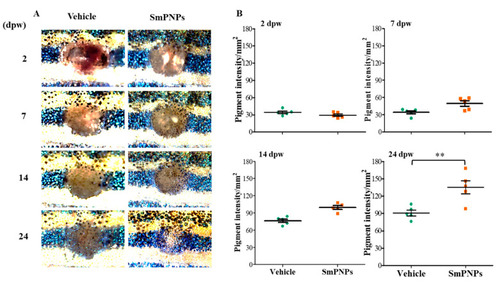
Effect of SmPNPs on pigment restoration during the wound healing. (A) Respective images showing the pigment development and accumulation on the wound site, and (B) Quantitative analysis of pigment development at 2, 7, 14, and 24 dpw. Error bars represent the means plus or minus (± SD) standard deviation (Unpaired two-tailed t-test, ** p < 0.01, n = 5).

Effect of SmPNPs on wound healing by histology assessment; Hematoxylin and Eosin (H&E) staining of transverse sections of control (unwounded), vehicle (wounded; vehicle treated), SmPNPs (wounded; SmPNPs treated) muscle tissues at 2 and 7 dpw. Normal epidermis (black arrows), dermis and scale (arrowheads), persistent inflammation and thin layer of neoepithelium (blue arrows), completely re-epithelialized with a neoepidermis of multiple cell layer (red arrows) are shown in respective figures. Scale bar × 40 = 500 µm, × 200 = 100 µm.

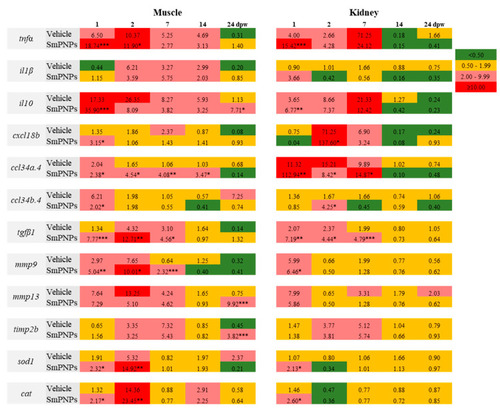
Time-course transcriptional analysis of genes related to wound healing in muscle and kidney of zebrafish. The wounded fish had been treated with vehicle and SmPNPs at different time points (1, 2, 7, 14, and 24 dpw) were analyzed. Data are expressed as means plus or minus standard deviation (± SD) of triplicate samples; (Unpaired two-tailed t-test * p < 0.05, ** p < 0.01, *** p < 0.001). Relative fold-change in gene expression was determined by dividing the average relative expression of each individual at selected time points (n = 3) by the average relative expression of control group at day 1 (n = 3). Basal level, upregulated and downregulated expressions are considered as 0.50–1.99, ≥ 2.0-fold and < 0.5-fold, respectively.

Acknowledgments
This image is the copyrighted work of the attributed author or publisher, and ZFIN has permission only to display this image to its users. Additional permissions should be obtained from the applicable author or publisher of the image. Full text @ Mar. Drugs