FIGURE SUMMARY
Title

Organophosphorus diisopropylfluorophosphate (DFP) intoxication in zebrafish larvae causes behavioral defects, neuronal hyperexcitation and neuronal death

Authors
Brenet, A., Somkhit, J., Hassan-Abdi, R., Yanicostas, C., Romain, C., Bar, O., Igert, A., Saurat, D., Taudon, N., Dal-Bo, G., Nachon, F., Dupuis, N., Soussi-Yanicostas, N.
Source
Full text @ Sci. Rep.

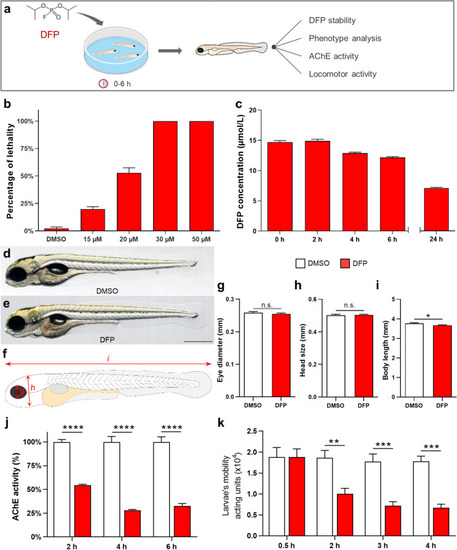
DFP-exposed zebrafish larvae displayed reduced motility and AChE inhibition. (a) As experimental set-up, 5 dpf larvae were exposed to 15, 20, 30 or 50 µM DFP or vehicle (1% DMSO) and larval lethality, phenotypic defects, motor activity, and AChE activity were studied during the next 6 h. (b) Lethality rates of 5 dpf larvae exposed for 6 h to 15, 20, 30 or 50 µM DFP and selection of 15 µM DFP as optimal concentration (LC20). (c) Residual concentrations of DFP measured at different time points from a 15 µM solution diluted in fish water (E3 medium). (d,e) Morphology of 5 dpf larvae exposed for 6 h to either vehicle (d) or 15 µM DFP (e). (f) Scheme depicting measurements of zebrafish larva morphology. (g–i) Quantification of eye diameter (g), head size (h) and body length (i) in larvae exposed for 6 h to either vehicle (n = 26) or 15 µM DFP (n = 26) (Student’s unpaired t-test: n.s., non-significant; *, p < 0.05). (j) Quantification of AChE activity in larvae exposed to 15 µM DFP (n = 5) or vehicle (n = 5), for 2, 4, and 6 h (two-way ANOVA with Sidak’s multiple comparisons test: ****, p < 0.0001). (k) Motor activity of 5 dpf larvae exposed to either 15 µM DFP (n = 44) or vehicle (n = 12) (two-way ANOVA with Sidak’s multiple comparisons test: **, p < 0.01; ***, p < 0.001).

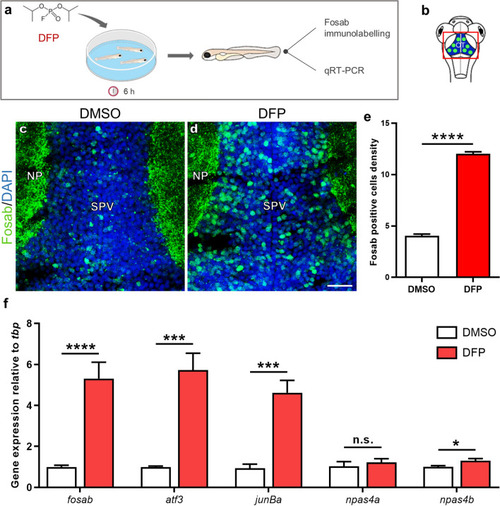
DFP exposure induces overexpression of the IEGs fosab, atf3, junBa, and npas4b. (a) As experimental set-up, 5 dpf larvae were exposed for 6 h to either 15 µM DFP or vehicle (1% DMSO) before processing for either Fosab immunostaining or brain dissection followed by RNA extraction and qRT-PCR analysis. (b) Scheme of a 5 dpf larva head with the red box showing the region of interest in the brain, uncovering the optic tectum (OT). (c,d) Fosab immunolabeling of optic tectum neurons in 5 dpf larvae exposed to either vehicle (c) or 15 µM DFP (d). Scale bar: 20 µm. (e) Quantification of Fosab-expressing neuron density in the optic tectum of 5 dpf larvae exposed to either vehicle (N = 3; n = 8) or 15 µM DFP (N = 3; n = 11) (unpaired t-test: ****, p < 0.0001). (f) qRT-PCR analysis of the accumulation of fosab, atf3, junBa, npas4a and npas4b RNAs relative to that of tbp in 5 dpf larvae exposed to either vehicle (n = 6) or 15 µM DFP (n = 6) (Student’s unpaired t-test: n.s., non-significant; *, p < 0.05; ***, p < 0.001; ****, p < 0.0001). N = number of larvae and n = number of slices. Abbreviations: NP, neuropil; SPV, stratum periventriculare.

DFP exposure caused neuronal hyperexcitation. (a) As experimental set-up, 5 dpf Tg[Huc:GCaMP5G] larvae were exposed to either 15 µM DFP or vehicle (1% DMSO), and calcium transients were recorded in brain neurons during the next 6 h. (b) Scheme of a 5 dpf larva head with the red box showing the region of interest in the brain, uncovering the optic tectum (OT). (c,d) Snapshot views of calcium imaging in a 5 dpf Tg[Huc:GCaMP5G] larva brain showing baseline calcium transients (c in Fig. 2e) and seizure-like hyperactivity seen 3 h after exposure to 15 µM DFP (d in Fig. 2f). (e,f) Baseline calcium transients detected in 5 dpf Tg[Huc:GCaMP5G] control larvae (n = 3) (e) and massive calcium transients detected in 5 dpf Tg[Huc:GCaMP5G] larvae exposed for 6 h to 15 µM DFP (n = 4) (f). (g) Amplitude of calcium transients detected in 5 dpf Tg[Huc:GCaMP5G] larvae at different time points following exposure to either 15 µM DFP (n = 4) or vehicle (n = 3) (two-way ANOVA with Sidak’s multiple comparisons test: n.s., non-significant; **, p < 0.01; ***, p < 0.001). (h) Number of calcium transients showing ΔF/F0 > 0.04 in 5 dpf Tg[Huc:GCaMP5G] larvae at different time points following exposure to either 15 µM DFP (n = 4) or vehicle (n = 3) (two-way ANOVA with Sidak’s multiple comparisons test: n.s., non-significant; **, p < 0.01; ****, p < 0.0001). (i) Pattern of calcium transients seen in 5 dpf Tg[Huc:GCaMP5G] larvae exposed for 5 h to 15 µM DFP and then to 15 µM DFP + 40 µM diazepam (DZP) for an additional hour. (j) Number of calcium transients showing ΔF/F0 > 0.04 in 5 dpf Tg[Huc:GCaMP5G] larvae exposed for 5 h to 15 µM DFP and then to 15 µM DFP + 40 µM diazepam (DZP) for an additional hour (n = 6) (Student’s unpaired t-test: **, p < 0.01).

DFP exposure increased cell apoptosis. (a) As experimental set-up, 5 dpf larvae were exposed to either 15 µM DFP or vehicle (1% DMSO) for 6 h, before processing for either acridine orange (AO) staining or anti-activated caspase-3 (Act-casp3) immunolabeling. (b) Scheme of a 5 dpf larva head with the red box showing the region of interest in the brain, uncovering the optic tectum (OT). (c,d) Act-casp3 immunolabeling of OT neurons in 5 dpf larvae exposed for 6 h to either vehicle (c) or 15 µM DFP (d). (e) Quantification of Act-casp3-positive neurons in 5 dpf larvae exposed for 6 h to either 15 µM DFP (n = 12) or vehicle (n = 12) (Student’s unpaired t-test with Welch’s correction: ***, p < 0.001). (fh) Visualization of AO-labeled apoptotic neurons in 5 dpf larvae exposed for 6 h to either vehicle (f), or 15 µM DFP (g) or 15 µM DFP + 40 µM diazepam (h). (i) Quantification of the number of acridine orange positive cells in 5 dpf larvae exposed for 6 h to either vehicle (n = 24), or 15 µM DFP (n = 17) or 15 µM DFP + 40 µM diazepam (DZP) (n = 10) (one-way ANOVA with Tukey’s multiple comparisons test: *, p < 0.05; ***, p < 0.001). Scale bar: 50 µm.

DFP exposure caused increased NR2B-NMDA subunit receptor accumulation combined with decreased gephyrin and GABA signaling. (a) As experimental set-up, 5 dpf larvae were exposed to either 15 µM DFP or vehicle (DMSO) for 6 h, prior to being processed for NR2B-NMDA, gephyrin or GAD 65/67 immunolabeling. (b) Scheme of 5 dpf larva head highlighting the tectal neuropils in green. (c,d) NR2B-NMDA receptor immunolabelling of 5 dpf larvae brains exposed to either DMSO (c) or 15 µM DFP (d). Scale bar: 5 µm. (e) Quantification of NR2B-NMDA puncta density in 5 dpf larvae treated for 6 h with either DMSO (N = 4; n = 22) or 15 µM DFP (N = 4; n = 26) (Mann Whitney : ****, p < 0.0001). (f) Scheme of 5 dpf larva head highlighting the tectal neuropils in green. (g,h) Gephyrin immunolabelling of 5 dpf larvae brains exposed to either DMSO (g) or 15 µM DFP (h). Scale bar: 5 µm. (i) Quantification of gephyrin puncta density in 5 dpf larvae treated for 6 h with either DMSO (N = 4; n = 18) or 15 µM DFP (N = 4; n = 18) (Student unpaired t-test: **, p < 0.01). (j) Scheme of 5 dpf larva head highlighting stratum periventriculare in blue and green. (k,l) GAD65/67 immunolabelling of neurons in the optic tectum of 5 dpf larvae brains exposed to either DMSO (k) or 15 µM DFP (l). Scale bar :10 µm. (m) Quantification of the density of neurons expressing GAD65/67 protein in the optic tectum of 5 dpf larvae exposed to either DMSO (N = 4; n = 18) or 15 µM DFP (N = 4; n = 19) (Student unpaired t-test : **, p < 0.01). N = number of larvae and n = number of slices.

Acknowledgments
This image is the copyrighted work of the attributed author or publisher, and ZFIN has permission only to display this image to its users. Additional permissions should be obtained from the applicable author or publisher of the image. Full text @ Sci. Rep.