FIGURE SUMMARY
Title

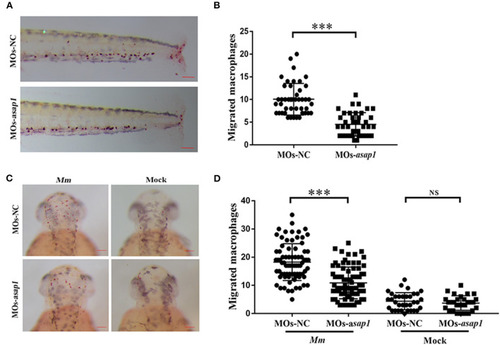
Asap1 Affects the Susceptibility of Zebrafish to Mycobacterium by Regulating Macrophage Migration

Authors
Cui, J., Chen, G., Wen, D., Wang, Y., Zhao, Z., Wu, C.
Source
Full text @ Front Cell Infect Microbiol

ZFIN is incorporating published figure images and captions as part of an ongoing project. Figures from some publications have not yet been curated, or are not available for display because of copyright restrictions.

ZFIN is incorporating published figure images and captions as part of an ongoing project. Figures from some publications have not yet been curated, or are not available for display because of copyright restrictions.

ZFIN is incorporating published figure images and captions as part of an ongoing project. Figures from some publications have not yet been curated, or are not available for display because of copyright restrictions.

Multiple sequence alignment of zebrafish Asap1a (ENSDART00000144870.3) and Asap1b (ENSDART00000145466.3) with human ASAP1 (ENST00000518721.6), rat ASAP1 (ENSRNOT00000079524.1), and mouse ASAP1 (ENSMUST00000177374.7). Five domains common between all ASAP1 are indicated by different color boxes.

Expression pattern of zebrafish asap1 homologs during embryonic development. (A) Temporal expression profiles of asap1a and asap1b by qRT-PCR. **P < 0.01, ***P < 0.001 vs. 24 hpf control group using Student's unpaired t-test. Data shown are representative of 3 independent experiments. (B) Spatial expression of asap1a (upper panels) and asap1b (lower panels) by whole mount in situ hybridization in wild-type embryos, the sense probe served as negative control (Scale bar, 100 μm).

EXPRESSION / LABELING:
Genes:
Fish:
Anatomical Terms:
Stage Range: 1-cell to Day 5

asap1 morphants exhibit altered susceptibility to Mm infection. (A,B) Western blotting (A) and qRT-PCR (B) analysis of the knockdown efficiency of asap1 morphants in 1, 5, and 10 dpf zebrafish. *P < 0.05, **P < 0.01 vs. control morphants using Student's unpaired t-test. The antibody was against both Asap1a and Asap1b. Data shown are representative of 3 independent experiments. (C) Schematic diagram of the yolk injection method. (D,E) Representative fluorescence images and quantification of bacterial burdens by fluorescence pixel counts of controls, asap1 morphants, or asap1 morphants treated with asap1 mRNA at 5 dpi with equivalent bacterial inocula by the yolk injection method (scale bar 500 μm); *P < 0.05, P-values calculated by Kruskal-Wallis with Dunn's post-test. n (MOs-NC group) = 27, n (MOs-asap1 group) = 27, n (MOs-asap1+asap1mRNA group) = 20. Mean ± SEM from four pooled independent experiments. (F) Schematic diagram of the intravenous injection method. (G,H) Representative fluorescence images and quantification of bacterial burdens by fluorescence pixel counts of controls, asap1 morphants or asap1 morphants treated with asap1 mRNA at 5 dpi with equivalent bacterial inocula by the intravenous injection method (scale bar, 500 μm); **P < 0.01, NS, not significant, P-values calculated by Kruskal-Wallis with Dunn's post-test. n (MOs-NC group) = 18, n (MOs-asap1 group) = 19, n (MOs-asap1+asap1mRNA group) = 20. Each dot represents one larva. Mean ± SEM from three pooled independent experiments. MOs, morpholino oligonucleotide mixture. asap1 means asap1a and asap1b.

asap1 morphant macrophages exhibit impaired migration. (A) Representative light microscopy images of neutral red stained macrophages of transgenic morphants migrated to tailfin injury at 9 h post injury. (B) Numbers of recruited neutral red stained macrophages in the tailfin injury at 9 h post injury (scale bar, 100 μm); *** P < 0.001, P-values calculated by Student's unpaired t-test. n (MOs-NC group) = 45, n (MOs-asap1 group) = 40. (C) Representative light microscopy images of neutral red stained macrophages following hindbrain injection with Mm (left panels) or mock (right panels) into morphants at 9 h post infection. (D) Numbers of recruited neutral red stained macrophages in the hindbrain at 9 h post infection (scale bar, 100 μm); ***P < 0.001, NS, not significant, P-values calculated between two groups by Student's unpaired t-test. n (MOs-NC group/Mm) = 77, n (MOs-asap1 group/Mm) = 81, n (MOs-NC group/mock) =34, n (MOs-asap1 group/mock) =29. Each dot represents one larva. Mean ± SEM from two pooled independent experiments. MOs, morpholino oligonucleotide mixture. asap1 means asap1a and asap1b.

Migration of cells is impaired in THP-1 cells upon knockdown of ASAP1. (A) Western blotting analysis of the knockdown efficiency of ASAP1 when THP-1 cells were transfected with control or ASAP1 siRNA. (B) Schematic diagram of the Transwell protocol. (C,D) Transwell assay was applied to evaluate the effect of ASAP1 on cell migration (scale bar, 500 μm); ***P < 0.001, P-values calculated by the Mann-Whitney test. Each dot represents one scope. Mean ± SEM from two independent experiments.

Acknowledgments
This image is the copyrighted work of the attributed author or publisher, and ZFIN has permission only to display this image to its users. Additional permissions should be obtained from the applicable author or publisher of the image. Full text @ Front Cell Infect Microbiol