
- Title
-
Size-selective mortality induces evolutionary changes in group risk-taking behavior and the circadian system in a fish
- Authors
- Sbragaglia, V., López-Olmeda, J.F., Frigato, E., Bertolucci, C., Arlinghaus, R.
- Source
- Full text @ J Anim Ecol

The conceptual framework of the putative mechanisms driving evolution of risk‐taking behaviour and circadian system in response to size‐selective mortality. The figure showed large size‐selective mortality typical of many fisheries and specialized predators targeting larger size classes. The same conceptual framework with opposing outcomes is valid for small size‐selective mortality typical of specialized fisheries and most gape‐limited predators. In particular, large size‐selective harvesting triggers the evolution of a fast life history, which in turn can co‐evolve with an increase of both risk‐taking behaviour and early peaks of locomotor activity (small dotted arrows). However, a plausible scenario is that harvesting disrupts the correlation of life history with other behavioural traits. Therefore, a further possibility is that large‐size selective harvesting triggers the evolution of a decrease risk‐taking behaviour through a correlated selection response with size‐at‐harvest (bold arrow and first hypothesis tested here; H1). Consequently, a decrease of risk‐taking behaviour may affect the circadian system by triggering a decrease of early locomotor activity rhythms (bold arrow and second hypothesis; H2), and reducing amplitude and robustness of circadian clock gene expression (bold arrow and third hypothesis; H3). For more details, see the main text (Fish pic source: https://pixy.org/4660397/) |

Results of the diving test used to assess group risk‐taking behaviour in the zebrafish selection lines in two consecutive trials at 230 and 240 dpf. Data are presented as cumulative time (bin in 30‐s period) spent by zebrafish shoals at the surface of the water (7 cm; see Figure S2; Video S1) once moved to a novel tank. Food has been added at 03:00 and the predator approached at 03:30. We first model the data with a non‐orthogonal quadratic polynomial mixed model by splitting the data into two sections: (i) before the approach of the simulated predator; (ii) after the approach of the simulated predator (a). Moreover, to assess differences among selection lines in risk‐taking behaviour as specific time points of the experimental assay, we implemented a linear mixed model for each 30‐s time bins (b). Finally, we calculated adjusted repeatability (i.e. after controlling for fixed effects of selection lines) of risk‐taking behaviour for each 30‐s time bin across time (230–240 dpf) by using the same mixed effects models implemented before (a). Repeatability scores (right axis in a) are presented as empty circles (when they were not significantly different from zero) and solid circles (when they were significantly different from zero; see also Tables S2–S4 and Figure S4 for further details and partitioning of variance components). The different colours represent the selection lines (N = 12 for each selection line) together with confidence intervals (dashed coloured lines in a), median (points in b) and lower and upper quartiles (vertical lines in b). Bird pic source: https://www.piqsels.com. Significant difference is indicated by black horizontal lines (†p < 0.10; *p < 0.05; **p < 0.01) |
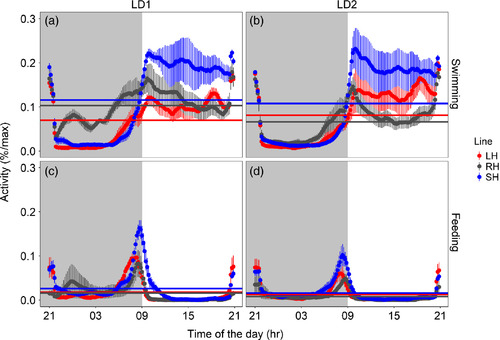
Mean waveforms (time scale 24 hr) for swimming (a, b) and self‐feeding (c, d) activity of zebrafish shoals are expressed as percentage of the maximum during the first (LD1: days 1–15) and second (LD2: days 22–36) light–dark trial. Each point represents the 10‐min binned mean across all the experimental days in LD1 and LD2 for all the groups. The different colours represent the selection lines: red for large‐harvested (LH; N = 6) grey for control (RH; N = 6) and blue for small‐harvested (SH; N = 5). The horizontal lines represent the midline estimating statistic of rhythm as reported in Table 1. The vertical lines represent the standard error (N between 75 and 90). Grey shadowed areas represent the dark hours (lights on is at time of the day = 09:00) |
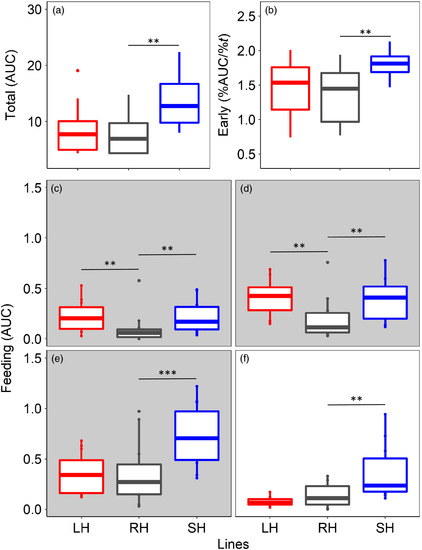
Total swimming activity during light hours (a; area under the waveform curve, AUC) and early daily activity (b; percentage of activity during the first 4 hr of light) together with self‐feeding activity (c–f; area under the waveform curve, AUC) during the last 3 hr of scotophase (grey shadow; c = 06:00–07:00; d = 07:00–08:00; e = 08:00–09:00) and the first hour of photophase (f = 09:00–10:00). The different colours represent the selection lines: red for large‐harvested (LH) grey for control (RH) and blue for small‐harvested (SH); N between 5 and 6 (see Table 1 for more details). Boxplots represent the median (bold centreline), the 25th (top of the box) and 75th percentile (bottom of the box). Significant differences are indicated by black horizontal lines (**p < 0.01; ***p < 0.001; see text for more details) |
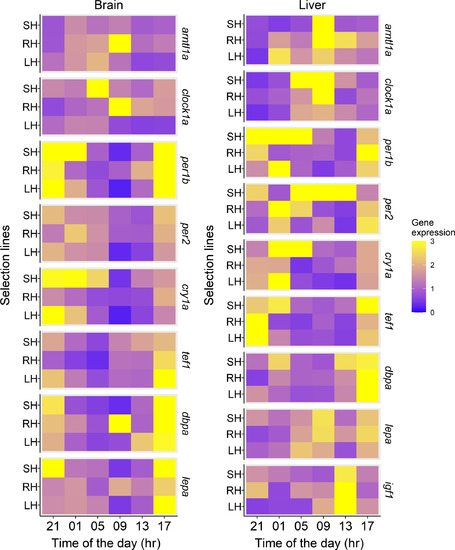
Mean endogenous (i.e. measured under constant dim light) transcript abundance of the genes related to the circadian system and clock‐controlled genes related to growth and energy balance in the brain (left) and liver (right) at different times of the day for the three selection lines (large‐harvested: LH, small‐harvested: SH and control: RH; N between 4 and 5, see Table 2 for p values and more details) |
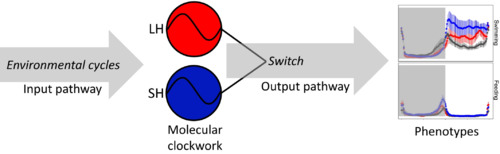
The conceptual framework of the downstream switch we proposed to explain the results presented here. The circadian clock synchronized with the environmental cycles (e.g. light–dark cycle or feeding). Next, the size‐selective harvesting (large‐harvested in red: LH; small‐harvested in blue: SH) triggers the evolution of different molecular circadian clockwork with respect to control. Finally, in the output pathway the different molecular circadian clockwork is switched to produce a similar output driving the overall daily activity rhythms phenotypes (i.e. swimming during light hours and self‐feeding activity in the last hours of darkness) |